White/Caucasian vs Crow Unemployment Among Seniors over 65 years
COMPARE
White/Caucasian
Crow
Unemployment Among Seniors over 65 years
Unemployment Among Seniors over 65 years Comparison
Whites/Caucasians
Crow
5.1%
UNEMPLOYMENT AMONG SENIORS OVER 65 YEARS
84.4/ 100
METRIC RATING
136th/ 347
METRIC RANK
16.9%
UNEMPLOYMENT AMONG SENIORS OVER 65 YEARS
0.0/ 100
METRIC RATING
347th/ 347
METRIC RANK
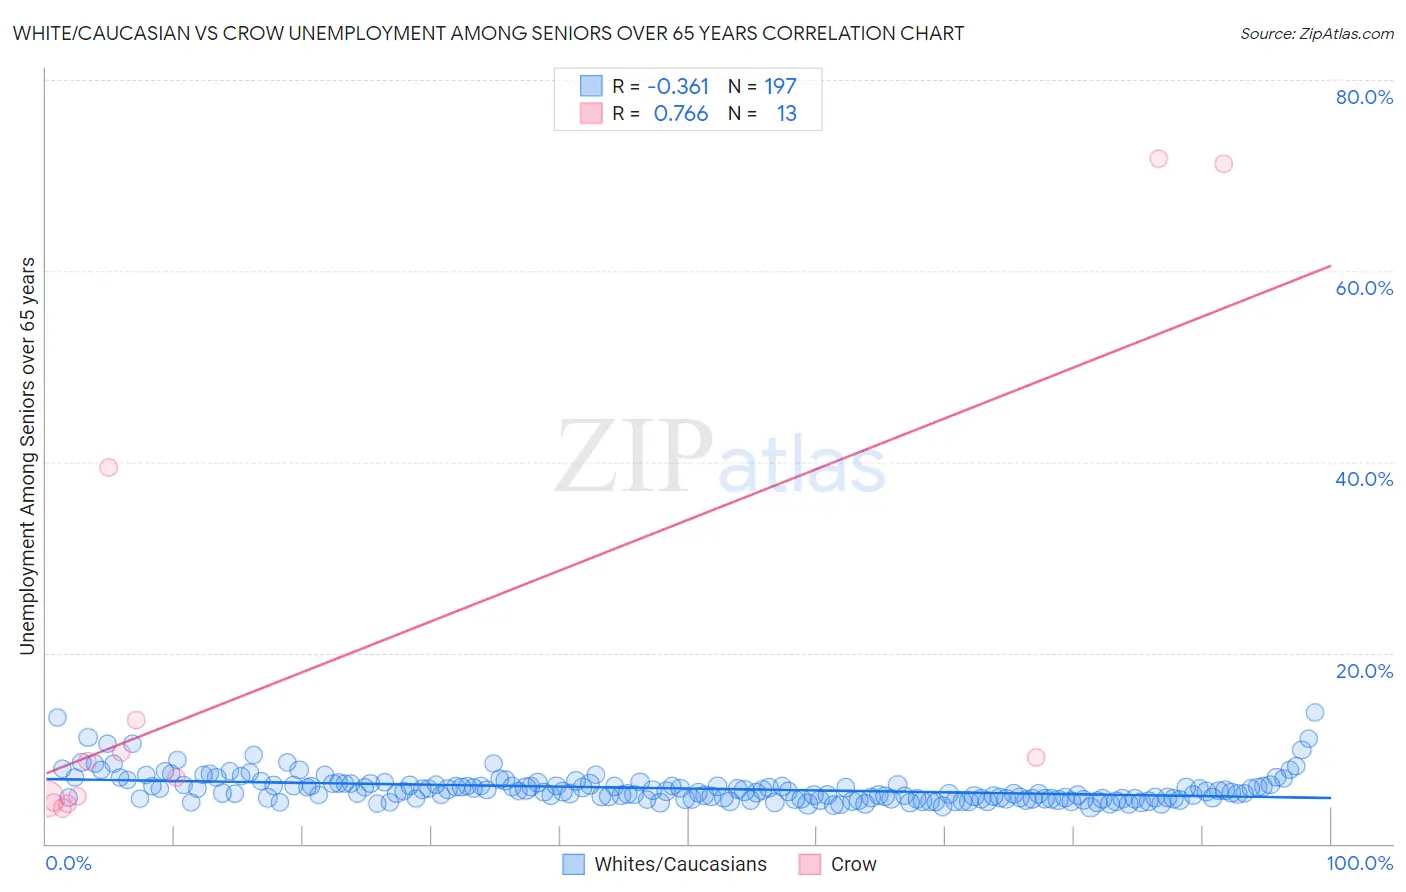
White/Caucasian vs Crow Unemployment Among Seniors over 65 years Correlation Chart
The statistical analysis conducted on geographies consisting of 465,209,584 people shows a mild negative correlation between the proportion of Whites/Caucasians and unemployment rate amomg seniors over the age of 65 in the United States with a correlation coefficient (R) of -0.361 and weighted average of 5.1%. Similarly, the statistical analysis conducted on geographies consisting of 56,531,243 people shows a strong positive correlation between the proportion of Crow and unemployment rate amomg seniors over the age of 65 in the United States with a correlation coefficient (R) of 0.766 and weighted average of 16.9%, a difference of 232.0%.
Unemployment Among Seniors over 65 years Correlation Summary
| Measurement | White/Caucasian | Crow |
| Minimum | 3.9% | 3.7% |
| Maximum | 13.8% | 71.7% |
| Range | 9.9% | 68.0% |
| Mean | 5.8% | 19.3% |
| Median | 5.5% | 8.7% |
| Interquartile 25% (IQ1) | 4.7% | 4.5% |
| Interquartile 75% (IQ3) | 6.2% | 26.2% |
| Interquartile Range (IQR) | 1.5% | 21.7% |
| Standard Deviation (Sample) | 1.6% | 24.9% |
| Standard Deviation (Population) | 1.6% | 24.0% |
Similar Demographics by Unemployment Among Seniors over 65 years
Demographics Similar to Whites/Caucasians by Unemployment Among Seniors over 65 years
In terms of unemployment among seniors over 65 years, the demographic groups most similar to Whites/Caucasians are Ukrainian (5.1%, a difference of 0.0%), Arab (5.1%, a difference of 0.0%), Turkish (5.1%, a difference of 0.030%), Syrian (5.1%, a difference of 0.060%), and New Zealander (5.1%, a difference of 0.070%).
| Demographics | Rating | Rank | Unemployment Among Seniors over 65 years |
| Immigrants | England | 86.7 /100 | #129 | Excellent 5.1% |
| Iranians | 86.6 /100 | #130 | Excellent 5.1% |
| Immigrants | Australia | 85.8 /100 | #131 | Excellent 5.1% |
| Chileans | 85.6 /100 | #132 | Excellent 5.1% |
| Syrians | 85.3 /100 | #133 | Excellent 5.1% |
| Turks | 84.9 /100 | #134 | Excellent 5.1% |
| Ukrainians | 84.4 /100 | #135 | Excellent 5.1% |
| Whites/Caucasians | 84.4 /100 | #136 | Excellent 5.1% |
| Arabs | 84.3 /100 | #137 | Excellent 5.1% |
| New Zealanders | 83.2 /100 | #138 | Excellent 5.1% |
| Immigrants | Panama | 83.0 /100 | #139 | Excellent 5.1% |
| Immigrants | Chile | 83.0 /100 | #140 | Excellent 5.1% |
| Cherokee | 81.6 /100 | #141 | Excellent 5.1% |
| Immigrants | Indonesia | 81.0 /100 | #142 | Excellent 5.1% |
| Senegalese | 80.4 /100 | #143 | Excellent 5.1% |
Demographics Similar to Crow by Unemployment Among Seniors over 65 years
In terms of unemployment among seniors over 65 years, the demographic groups most similar to Crow are Yup'ik (9.1%, a difference of 84.6%), Immigrants from Yemen (8.2%, a difference of 105.7%), Alaskan Athabascan (7.0%, a difference of 139.3%), Tlingit-Haida (6.8%, a difference of 148.3%), and Navajo (6.7%, a difference of 151.5%).
| Demographics | Rating | Rank | Unemployment Among Seniors over 65 years |
| Immigrants | Dominican Republic | 0.0 /100 | #333 | Tragic 6.0% |
| Tohono O'odham | 0.0 /100 | #334 | Tragic 6.1% |
| Immigrants | Armenia | 0.0 /100 | #335 | Tragic 6.2% |
| Pima | 0.0 /100 | #336 | Tragic 6.3% |
| Alaska Natives | 0.0 /100 | #337 | Tragic 6.3% |
| Immigrants | Azores | 0.0 /100 | #338 | Tragic 6.3% |
| Paiute | 0.0 /100 | #339 | Tragic 6.3% |
| Ute | 0.0 /100 | #340 | Tragic 6.3% |
| Yakama | 0.0 /100 | #341 | Tragic 6.7% |
| Navajo | 0.0 /100 | #342 | Tragic 6.7% |
| Tlingit-Haida | 0.0 /100 | #343 | Tragic 6.8% |
| Alaskan Athabascans | 0.0 /100 | #344 | Tragic 7.0% |
| Immigrants | Yemen | 0.0 /100 | #345 | Tragic 8.2% |
| Yup'ik | 0.0 /100 | #346 | Tragic 9.1% |
| Crow | 0.0 /100 | #347 | Tragic 16.9% |