White/Caucasian vs Hmong Child Poverty Among Girls Under 16
COMPARE
White/Caucasian
Hmong
Child Poverty Among Girls Under 16
Child Poverty Among Girls Under 16 Comparison
Whites/Caucasians
Hmong
16.6%
CHILD POVERTY AMONG GIRLS UNDER 16
43.6/ 100
METRIC RATING
178th/ 347
METRIC RANK
17.5%
CHILD POVERTY AMONG GIRLS UNDER 16
10.6/ 100
METRIC RATING
207th/ 347
METRIC RANK
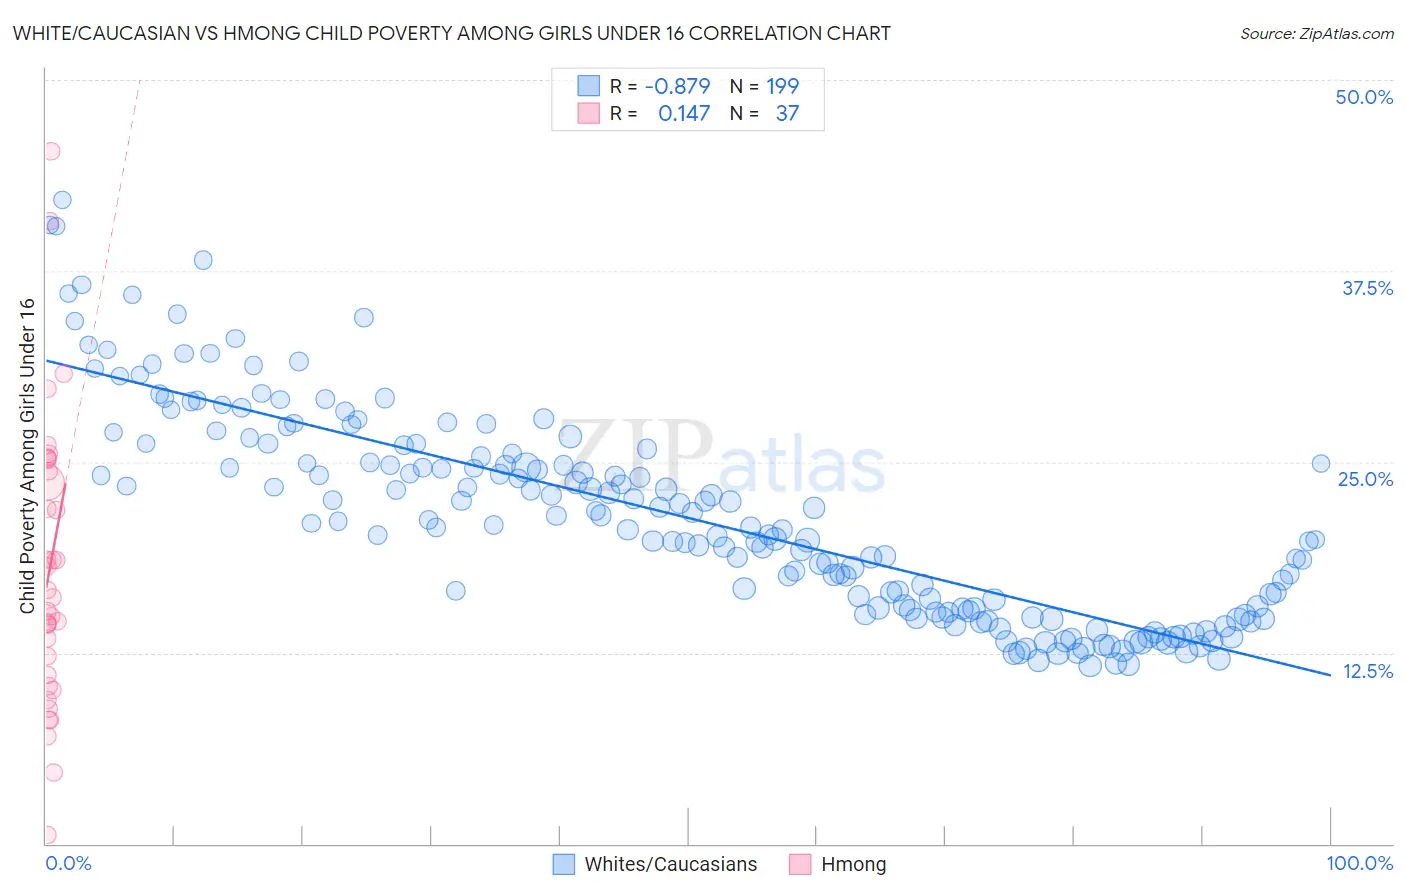
White/Caucasian vs Hmong Child Poverty Among Girls Under 16 Correlation Chart
The statistical analysis conducted on geographies consisting of 558,680,954 people shows a very strong negative correlation between the proportion of Whites/Caucasians and poverty level among girls under the age of 16 in the United States with a correlation coefficient (R) of -0.879 and weighted average of 16.6%. Similarly, the statistical analysis conducted on geographies consisting of 24,646,023 people shows a poor positive correlation between the proportion of Hmong and poverty level among girls under the age of 16 in the United States with a correlation coefficient (R) of 0.147 and weighted average of 17.5%, a difference of 5.3%.
Child Poverty Among Girls Under 16 Correlation Summary
| Measurement | White/Caucasian | Hmong |
| Minimum | 11.7% | 0.61% |
| Maximum | 42.2% | 45.4% |
| Range | 30.5% | 44.8% |
| Mean | 21.4% | 18.0% |
| Median | 20.7% | 16.1% |
| Interquartile 25% (IQ1) | 15.2% | 10.7% |
| Interquartile 75% (IQ3) | 25.5% | 24.8% |
| Interquartile Range (IQR) | 10.3% | 14.1% |
| Standard Deviation (Sample) | 6.8% | 9.4% |
| Standard Deviation (Population) | 6.7% | 9.3% |
Similar Demographics by Child Poverty Among Girls Under 16
Demographics Similar to Whites/Caucasians by Child Poverty Among Girls Under 16
In terms of child poverty among girls under 16, the demographic groups most similar to Whites/Caucasians are Hawaiian (16.6%, a difference of 0.030%), Immigrants from Syria (16.6%, a difference of 0.040%), Immigrants from Western Asia (16.6%, a difference of 0.060%), Immigrants from Iraq (16.6%, a difference of 0.060%), and Immigrants from Ethiopia (16.6%, a difference of 0.070%).
| Demographics | Rating | Rank | Child Poverty Among Girls Under 16 |
| Immigrants | Saudi Arabia | 64.0 /100 | #171 | Good 16.2% |
| Afghans | 62.3 /100 | #172 | Good 16.2% |
| Immigrants | South America | 55.1 /100 | #173 | Average 16.4% |
| Ethiopians | 50.0 /100 | #174 | Average 16.5% |
| Lebanese | 45.4 /100 | #175 | Average 16.6% |
| Hungarians | 45.1 /100 | #176 | Average 16.6% |
| Immigrants | Western Asia | 44.1 /100 | #177 | Average 16.6% |
| Whites/Caucasians | 43.6 /100 | #178 | Average 16.6% |
| Hawaiians | 43.4 /100 | #179 | Average 16.6% |
| Immigrants | Syria | 43.3 /100 | #180 | Average 16.6% |
| Immigrants | Iraq | 43.2 /100 | #181 | Average 16.6% |
| Immigrants | Ethiopia | 43.1 /100 | #182 | Average 16.6% |
| Immigrants | Portugal | 42.5 /100 | #183 | Average 16.6% |
| Scotch-Irish | 39.6 /100 | #184 | Fair 16.7% |
| Immigrants | Uruguay | 35.6 /100 | #185 | Fair 16.7% |
Demographics Similar to Hmong by Child Poverty Among Girls Under 16
In terms of child poverty among girls under 16, the demographic groups most similar to Hmong are Delaware (17.4%, a difference of 0.25%), Immigrants from Cameroon (17.4%, a difference of 0.52%), Sierra Leonean (17.6%, a difference of 0.53%), Panamanian (17.6%, a difference of 0.59%), and Iraqi (17.4%, a difference of 0.62%).
| Demographics | Rating | Rank | Child Poverty Among Girls Under 16 |
| Immigrants | Uzbekistan | 21.5 /100 | #200 | Fair 17.1% |
| Immigrants | Kenya | 17.8 /100 | #201 | Poor 17.2% |
| Immigrants | Sierra Leone | 17.6 /100 | #202 | Poor 17.2% |
| Ugandans | 17.5 /100 | #203 | Poor 17.2% |
| Iraqis | 13.0 /100 | #204 | Poor 17.4% |
| Immigrants | Cameroon | 12.6 /100 | #205 | Poor 17.4% |
| Delaware | 11.5 /100 | #206 | Poor 17.4% |
| Hmong | 10.6 /100 | #207 | Poor 17.5% |
| Sierra Leoneans | 8.9 /100 | #208 | Tragic 17.6% |
| Panamanians | 8.7 /100 | #209 | Tragic 17.6% |
| Immigrants | Immigrants | 7.3 /100 | #210 | Tragic 17.7% |
| Immigrants | Eastern Africa | 6.4 /100 | #211 | Tragic 17.7% |
| Immigrants | Thailand | 6.3 /100 | #212 | Tragic 17.7% |
| Pennsylvania Germans | 5.7 /100 | #213 | Tragic 17.8% |
| Malaysians | 5.7 /100 | #214 | Tragic 17.8% |