White/Caucasian vs South American Child Poverty Among Girls Under 16
COMPARE
White/Caucasian
South American
Child Poverty Among Girls Under 16
Child Poverty Among Girls Under 16 Comparison
Whites/Caucasians
South Americans
16.6%
CHILD POVERTY AMONG GIRLS UNDER 16
43.6/ 100
METRIC RATING
178th/ 347
METRIC RANK
16.1%
CHILD POVERTY AMONG GIRLS UNDER 16
67.2/ 100
METRIC RATING
166th/ 347
METRIC RANK
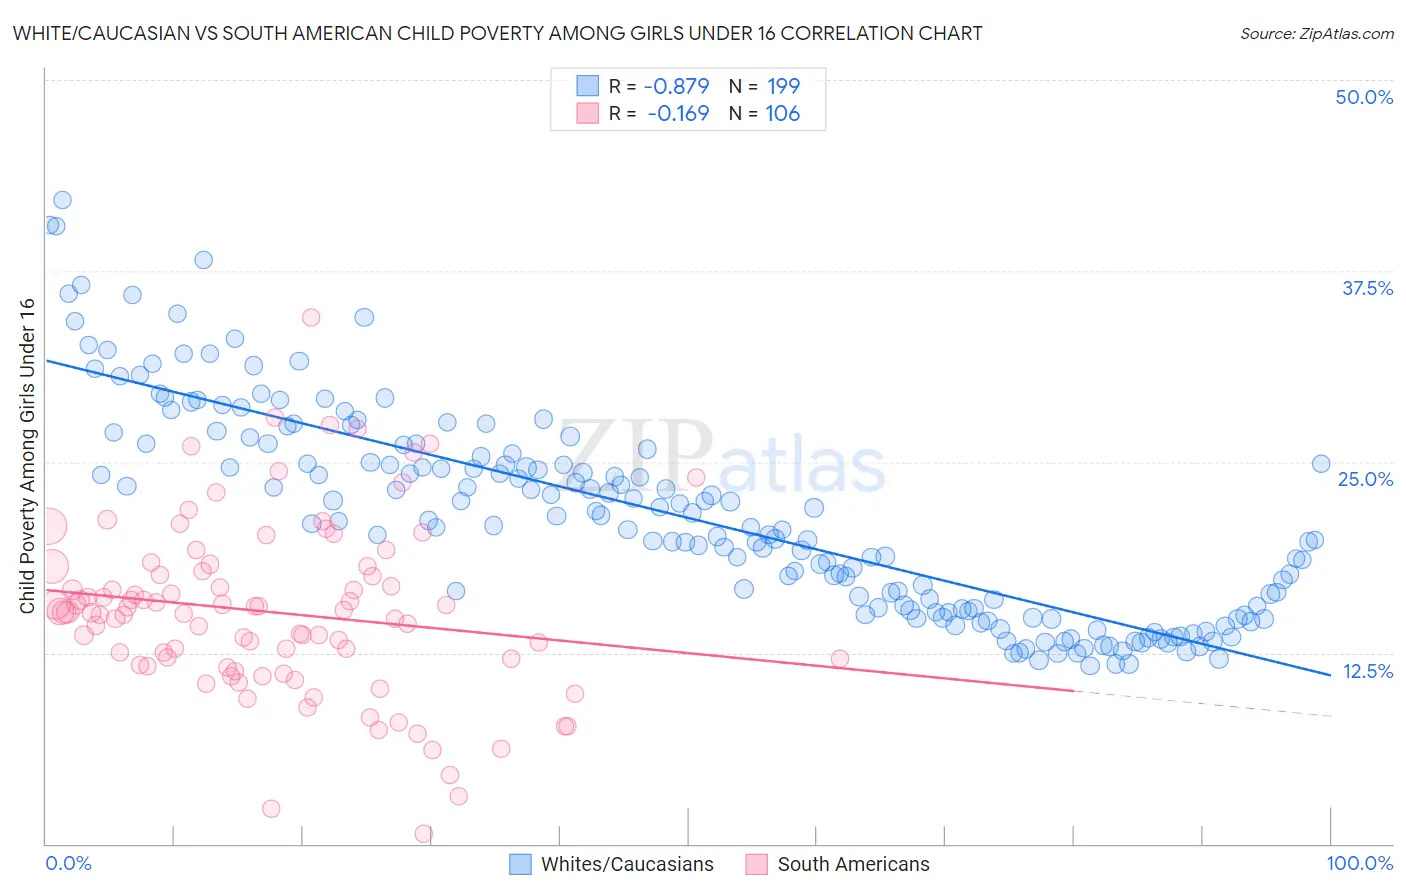
White/Caucasian vs South American Child Poverty Among Girls Under 16 Correlation Chart
The statistical analysis conducted on geographies consisting of 558,680,954 people shows a very strong negative correlation between the proportion of Whites/Caucasians and poverty level among girls under the age of 16 in the United States with a correlation coefficient (R) of -0.879 and weighted average of 16.6%. Similarly, the statistical analysis conducted on geographies consisting of 481,449,574 people shows a poor negative correlation between the proportion of South Americans and poverty level among girls under the age of 16 in the United States with a correlation coefficient (R) of -0.169 and weighted average of 16.1%, a difference of 2.9%.
Child Poverty Among Girls Under 16 Correlation Summary
| Measurement | White/Caucasian | South American |
| Minimum | 11.7% | 0.69% |
| Maximum | 42.2% | 34.5% |
| Range | 30.5% | 33.8% |
| Mean | 21.4% | 15.2% |
| Median | 20.7% | 15.1% |
| Interquartile 25% (IQ1) | 15.2% | 11.7% |
| Interquartile 75% (IQ3) | 25.5% | 17.9% |
| Interquartile Range (IQR) | 10.3% | 6.2% |
| Standard Deviation (Sample) | 6.8% | 5.7% |
| Standard Deviation (Population) | 6.7% | 5.7% |
Demographics Similar to Whites/Caucasians and South Americans by Child Poverty Among Girls Under 16
In terms of child poverty among girls under 16, the demographic groups most similar to Whites/Caucasians are Hawaiian (16.6%, a difference of 0.030%), Immigrants from Syria (16.6%, a difference of 0.040%), Immigrants from Western Asia (16.6%, a difference of 0.060%), Immigrants from Iraq (16.6%, a difference of 0.060%), and Immigrants from Ethiopia (16.6%, a difference of 0.070%). Similarly, the demographic groups most similar to South Americans are Immigrants from Germany (16.1%, a difference of 0.020%), Immigrants from Colombia (16.1%, a difference of 0.090%), Immigrants from Oceania (16.1%, a difference of 0.16%), French Canadian (16.1%, a difference of 0.21%), and Uruguayan (16.2%, a difference of 0.32%).
| Demographics | Rating | Rank | Child Poverty Among Girls Under 16 |
| French Canadians | 68.7 /100 | #162 | Good 16.1% |
| Immigrants | Oceania | 68.4 /100 | #163 | Good 16.1% |
| Immigrants | Colombia | 67.8 /100 | #164 | Good 16.1% |
| Immigrants | Germany | 67.3 /100 | #165 | Good 16.1% |
| South Americans | 67.2 /100 | #166 | Good 16.1% |
| Uruguayans | 64.7 /100 | #167 | Good 16.2% |
| Yugoslavians | 64.4 /100 | #168 | Good 16.2% |
| Costa Ricans | 64.2 /100 | #169 | Good 16.2% |
| Immigrants | Venezuela | 64.2 /100 | #170 | Good 16.2% |
| Immigrants | Saudi Arabia | 64.0 /100 | #171 | Good 16.2% |
| Afghans | 62.3 /100 | #172 | Good 16.2% |
| Immigrants | South America | 55.1 /100 | #173 | Average 16.4% |
| Ethiopians | 50.0 /100 | #174 | Average 16.5% |
| Lebanese | 45.4 /100 | #175 | Average 16.6% |
| Hungarians | 45.1 /100 | #176 | Average 16.6% |
| Immigrants | Western Asia | 44.1 /100 | #177 | Average 16.6% |
| Whites/Caucasians | 43.6 /100 | #178 | Average 16.6% |
| Hawaiians | 43.4 /100 | #179 | Average 16.6% |
| Immigrants | Syria | 43.3 /100 | #180 | Average 16.6% |
| Immigrants | Iraq | 43.2 /100 | #181 | Average 16.6% |
| Immigrants | Ethiopia | 43.1 /100 | #182 | Average 16.6% |