Immigrants from Cameroon vs Crow Child Poverty Among Girls Under 16
COMPARE
Immigrants from Cameroon
Crow
Child Poverty Among Girls Under 16
Child Poverty Among Girls Under 16 Comparison
Immigrants from Cameroon
Crow
17.4%
CHILD POVERTY AMONG GIRLS UNDER 16
12.6/ 100
METRIC RATING
205th/ 347
METRIC RANK
26.4%
CHILD POVERTY AMONG GIRLS UNDER 16
0.0/ 100
METRIC RATING
339th/ 347
METRIC RANK
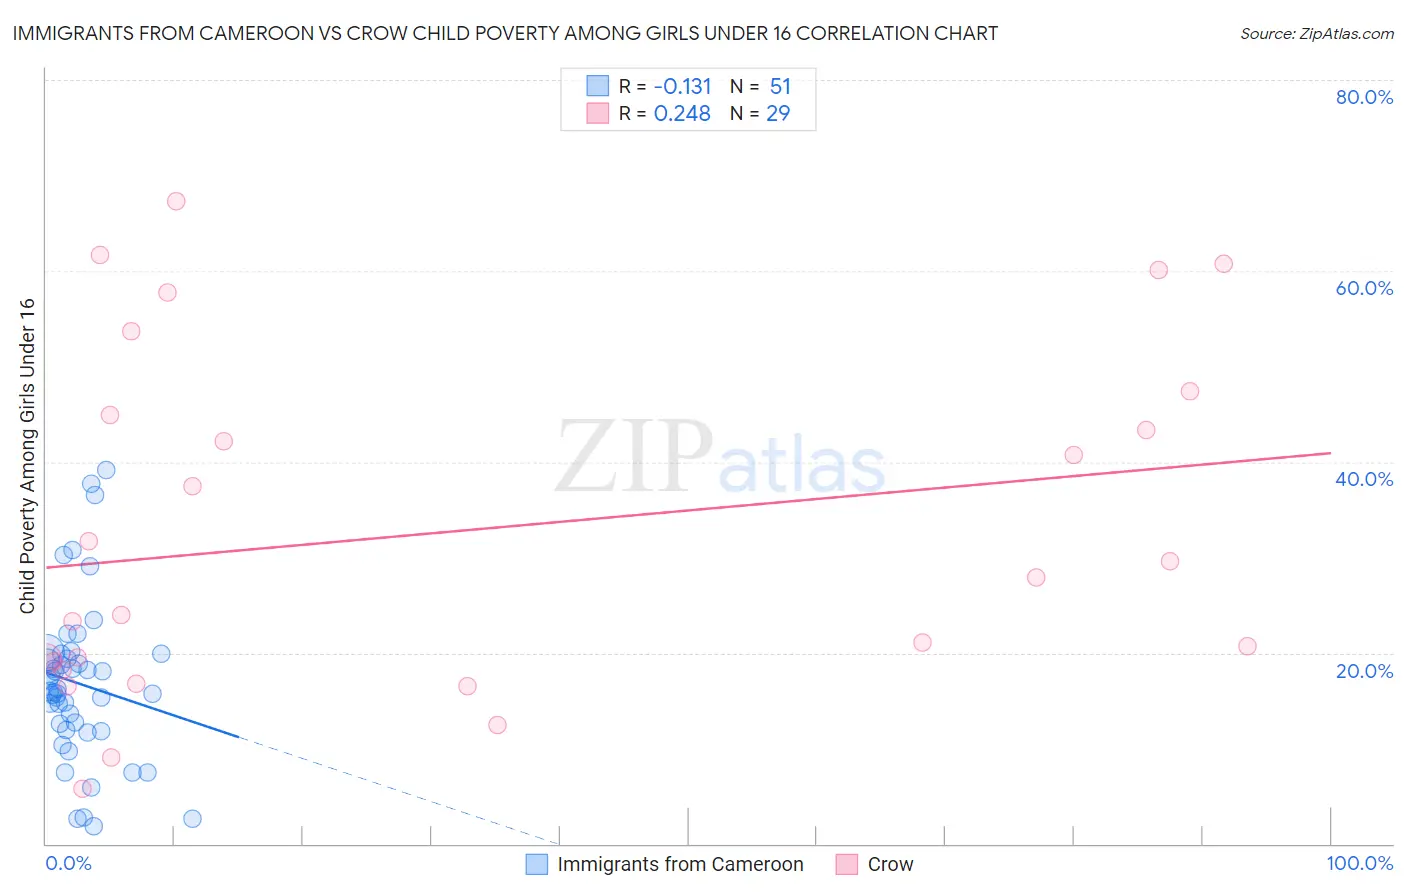
Immigrants from Cameroon vs Crow Child Poverty Among Girls Under 16 Correlation Chart
The statistical analysis conducted on geographies consisting of 130,176,141 people shows a poor negative correlation between the proportion of Immigrants from Cameroon and poverty level among girls under the age of 16 in the United States with a correlation coefficient (R) of -0.131 and weighted average of 17.4%. Similarly, the statistical analysis conducted on geographies consisting of 59,004,604 people shows a weak positive correlation between the proportion of Crow and poverty level among girls under the age of 16 in the United States with a correlation coefficient (R) of 0.248 and weighted average of 26.4%, a difference of 51.6%.
Child Poverty Among Girls Under 16 Correlation Summary
| Measurement | Immigrants from Cameroon | Crow |
| Minimum | 1.8% | 5.8% |
| Maximum | 39.2% | 67.4% |
| Range | 37.4% | 61.6% |
| Mean | 16.8% | 32.7% |
| Median | 16.0% | 27.9% |
| Interquartile 25% (IQ1) | 11.9% | 18.7% |
| Interquartile 75% (IQ3) | 19.9% | 46.2% |
| Interquartile Range (IQR) | 8.0% | 27.5% |
| Standard Deviation (Sample) | 8.3% | 17.9% |
| Standard Deviation (Population) | 8.2% | 17.6% |
Similar Demographics by Child Poverty Among Girls Under 16
Demographics Similar to Immigrants from Cameroon by Child Poverty Among Girls Under 16
In terms of child poverty among girls under 16, the demographic groups most similar to Immigrants from Cameroon are Iraqi (17.4%, a difference of 0.10%), Delaware (17.4%, a difference of 0.27%), Hmong (17.5%, a difference of 0.52%), Sierra Leonean (17.6%, a difference of 1.1%), and Ugandan (17.2%, a difference of 1.1%).
| Demographics | Rating | Rank | Child Poverty Among Girls Under 16 |
| Immigrants | Lebanon | 22.6 /100 | #198 | Fair 17.1% |
| Immigrants | Afghanistan | 22.4 /100 | #199 | Fair 17.1% |
| Immigrants | Uzbekistan | 21.5 /100 | #200 | Fair 17.1% |
| Immigrants | Kenya | 17.8 /100 | #201 | Poor 17.2% |
| Immigrants | Sierra Leone | 17.6 /100 | #202 | Poor 17.2% |
| Ugandans | 17.5 /100 | #203 | Poor 17.2% |
| Iraqis | 13.0 /100 | #204 | Poor 17.4% |
| Immigrants | Cameroon | 12.6 /100 | #205 | Poor 17.4% |
| Delaware | 11.5 /100 | #206 | Poor 17.4% |
| Hmong | 10.6 /100 | #207 | Poor 17.5% |
| Sierra Leoneans | 8.9 /100 | #208 | Tragic 17.6% |
| Panamanians | 8.7 /100 | #209 | Tragic 17.6% |
| Immigrants | Immigrants | 7.3 /100 | #210 | Tragic 17.7% |
| Immigrants | Eastern Africa | 6.4 /100 | #211 | Tragic 17.7% |
| Immigrants | Thailand | 6.3 /100 | #212 | Tragic 17.7% |
Demographics Similar to Crow by Child Poverty Among Girls Under 16
In terms of child poverty among girls under 16, the demographic groups most similar to Crow are Cheyenne (26.3%, a difference of 0.34%), Yup'ik (25.8%, a difference of 2.1%), Yuman (27.1%, a difference of 2.7%), Sioux (25.6%, a difference of 3.1%), and Pueblo (25.2%, a difference of 4.6%).
| Demographics | Rating | Rank | Child Poverty Among Girls Under 16 |
| Natives/Alaskans | 0.0 /100 | #332 | Tragic 24.0% |
| Blacks/African Americans | 0.0 /100 | #333 | Tragic 24.7% |
| Menominee | 0.0 /100 | #334 | Tragic 25.0% |
| Pueblo | 0.0 /100 | #335 | Tragic 25.2% |
| Sioux | 0.0 /100 | #336 | Tragic 25.6% |
| Yup'ik | 0.0 /100 | #337 | Tragic 25.8% |
| Cheyenne | 0.0 /100 | #338 | Tragic 26.3% |
| Crow | 0.0 /100 | #339 | Tragic 26.4% |
| Yuman | 0.0 /100 | #340 | Tragic 27.1% |
| Hopi | 0.0 /100 | #341 | Tragic 27.9% |
| Pima | 0.0 /100 | #342 | Tragic 28.2% |
| Immigrants | Yemen | 0.0 /100 | #343 | Tragic 29.5% |
| Navajo | 0.0 /100 | #344 | Tragic 30.5% |
| Lumbee | 0.0 /100 | #345 | Tragic 30.7% |
| Tohono O'odham | 0.0 /100 | #346 | Tragic 31.6% |