White/Caucasian vs Austrian Child Poverty Among Girls Under 16

COMPARE

White/Caucasian
Race
Ancestry
AfghanAfricanAlaska NativeAlaskan AthabascanAlbanianAleutAlsatianAmericanApacheArabArapahoArgentineanArmenianAssyrian/Chaldean/SyriacAustralianBahamianBangladeshiBarbadianBasqueBelgianBelizeanBermudanBhutaneseBlackfeetBolivianBrazilianBritishBritish West IndianBulgarianBurmeseCajunCambodianCanadianCape VerdeanCarpatho RusynCelticCentral AmericanCentral American IndianCherokeeCheyenneChickasawChileanChineseChippewaChoctawColombianColvilleComancheCosta RicanCreeCreekCroatianCrowCubanCypriotCzechCzechoslovakianDanishDelawareDominicanDutchDutch West IndianEastern EuropeanEcuadorianEgyptianEnglishEstonianEthiopianEuropeanFijianFilipinoFinnishFrenchFrench American IndianFrench CanadianGermanGerman RussianGhanaianGreekGuamanian/ChamorroGuatemalanGuyaneseHaitianHmongHonduranHopiHoumaHungarianIcelanderIndian (Asian)IndonesianInupiatIranianIraqiIrishIroquoisIsraeliItalianJamaicanJapaneseJordanianKenyanKiowaKoreanLaotianLatvianLebaneseLiberianLithuanianLumbeeLuxembourgerMacedonianMalaysianMalteseMarshalleseMenomineeMexicanMexican American IndianMongolianMoroccanNative HawaiianNavajoNepaleseNew ZealanderNicaraguanNigerianNorthern EuropeanNorwegianOkinawanOsageOttawaPaiutePakistaniPalestinianPanamanianParaguayanPennsylvania GermanPeruvianPimaPolishPortuguesePotawatomiPuebloPuerto RicanPuget Sound SalishRomanianRussianSalvadoranSamoanScandinavianScotch-IrishScottishSeminoleSenegaleseSerbianShoshoneSierra LeoneanSiouxSlavicSlovakSloveneSomaliSouth AfricanSouth AmericanSouth American IndianSoviet UnionSpaniardSpanishSpanish AmericanSpanish American IndianSri LankanSubsaharan AfricanSudaneseSwedishSwissSyrianTaiwaneseThaiTlingit-HaidaTohono O'OdhamTonganTrinidadian and TobagonianTsimshianTurkishU.S. Virgin IslanderUgandanUkrainianUruguayanUteVenezuelanVietnameseWelshWest IndianYakamaYaquiYugoslavianYumanYup'ikZimbabwean
Immigration
NonimmigrantsImmigrantsAfghanistanAfricaAlbaniaArgentinaArmeniaAsiaAustraliaAustriaBahamasBangladeshBarbadosBelarusBelgiumBelizeBoliviaBosnia and HerzegovinaBrazilBulgariaBurma/MyanmarCabo VerdeCambodiaCameroonCanadaCaribbeanCentral AmericaChileChinaColombiaCongoCosta RicaCroatiaCubaCzechoslovakiaDenmarkDominicaDominican RepublicEastern AfricaEastern AsiaEastern EuropeEcuadorEgyptEl SalvadorEnglandEritreaEthiopiaEuropeFijiFranceGermanyGhanaGreeceGrenadaGuatemalaGuyanaHaitiHondurasHong KongHungaryIndiaIndonesiaIranIraqIrelandIsraelItalyJamaicaJapanJordanKazakhstanKenyaKoreaKuwaitLaosLatin AmericaLatviaLebanonLiberiaLithuaniaMalaysiaMexicoMicronesiaMiddle AfricaMoldovaMoroccoNepalNetherlandsNicaraguaNigeriaNorth AmericaNorth MacedoniaNorthern AfricaNorthern EuropeNorwayOceaniaPakistanPanamaPeruPhilippinesPolandPortugalRomaniaRussiaSaudi ArabiaScotlandSenegalSerbiaSierra LeoneSingaporeSomaliaSouth AfricaSouth AmericaSouth Central AsiaSouth Eastern AsiaSouthern EuropeSpainSri LankaSt. Vincent and the GrenadinesSudanSwedenSwitzerlandSyriaTaiwanThailandTrinidad and TobagoTurkeyUgandaUkraineUruguayUzbekistanVenezuelaVietnamWest IndiesWestern AfricaWestern AsiaWestern EuropeYemenZaireZimbabweAzores
Austrian
Race
Ancestry
AfghanAfricanAlaska NativeAlaskan AthabascanAlbanianAleutAlsatianAmericanApacheArabArapahoArgentineanArmenianAssyrian/Chaldean/SyriacAustralianAustrianBahamianBangladeshiBarbadianBasqueBelgianBelizeanBermudanBhutaneseBlackfeetBolivianBrazilianBritishBritish West IndianBulgarianBurmeseCajunCambodianCanadianCape VerdeanCarpatho RusynCelticCentral AmericanCentral American IndianCherokeeCheyenneChickasawChileanChineseChippewaChoctawColombianColvilleComancheCosta RicanCreeCreekCroatianCrowCubanCypriotCzechCzechoslovakianDanishDelawareDominicanDutchDutch West IndianEastern EuropeanEcuadorianEgyptianEnglishEstonianEthiopianEuropeanFijianFilipinoFinnishFrenchFrench American IndianFrench CanadianGermanGerman RussianGhanaianGreekGuamanian/ChamorroGuatemalanGuyaneseHaitianHmongHonduranHopiHoumaHungarianIcelanderIndian (Asian)IndonesianInupiatIranianIraqiIrishIroquoisIsraeliItalianJamaicanJapaneseJordanianKenyanKiowaKoreanLaotianLatvianLebaneseLiberianLithuanianLumbeeLuxembourgerMacedonianMalaysianMalteseMarshalleseMenomineeMexicanMexican American IndianMongolianMoroccanNative HawaiianNavajoNepaleseNew ZealanderNicaraguanNigerianNorthern EuropeanNorwegianOkinawanOsageOttawaPaiutePakistaniPalestinianPanamanianParaguayanPennsylvania GermanPeruvianPimaPolishPortuguesePotawatomiPuebloPuerto RicanPuget Sound SalishRomanianRussianSalvadoranSamoanScandinavianScotch-IrishScottishSeminoleSenegaleseSerbianShoshoneSierra LeoneanSiouxSlavicSlovakSloveneSomaliSouth AfricanSouth AmericanSouth American IndianSoviet UnionSpaniardSpanishSpanish AmericanSpanish American IndianSri LankanSubsaharan AfricanSudaneseSwedishSwissSyrianTaiwaneseThaiTlingit-HaidaTohono O'OdhamTonganTrinidadian and TobagonianTsimshianTurkishU.S. Virgin IslanderUgandanUkrainianUruguayanUteVenezuelanVietnameseWelshWest IndianYakamaYaquiYugoslavianYumanYup'ikZimbabwean
Immigration
NonimmigrantsImmigrantsAfghanistanAfricaAlbaniaArgentinaArmeniaAsiaAustraliaAustriaBahamasBangladeshBarbadosBelarusBelgiumBelizeBoliviaBosnia and HerzegovinaBrazilBulgariaBurma/MyanmarCabo VerdeCambodiaCameroonCanadaCaribbeanCentral AmericaChileChinaColombiaCongoCosta RicaCroatiaCubaCzechoslovakiaDenmarkDominicaDominican RepublicEastern AfricaEastern AsiaEastern EuropeEcuadorEgyptEl SalvadorEnglandEritreaEthiopiaEuropeFijiFranceGermanyGhanaGreeceGrenadaGuatemalaGuyanaHaitiHondurasHong KongHungaryIndiaIndonesiaIranIraqIrelandIsraelItalyJamaicaJapanJordanKazakhstanKenyaKoreaKuwaitLaosLatin AmericaLatviaLebanonLiberiaLithuaniaMalaysiaMexicoMicronesiaMiddle AfricaMoldovaMoroccoNepalNetherlandsNicaraguaNigeriaNorth AmericaNorth MacedoniaNorthern AfricaNorthern EuropeNorwayOceaniaPakistanPanamaPeruPhilippinesPolandPortugalRomaniaRussiaSaudi ArabiaScotlandSenegalSerbiaSierra LeoneSingaporeSomaliaSouth AfricaSouth AmericaSouth Central AsiaSouth Eastern AsiaSouthern EuropeSpainSri LankaSt. Vincent and the GrenadinesSudanSwedenSwitzerlandSyriaTaiwanThailandTrinidad and TobagoTurkeyUgandaUkraineUruguayUzbekistanVenezuelaVietnamWest IndiesWestern AfricaWestern AsiaWestern EuropeYemenZaireZimbabweAzores
Child Poverty Among Girls Under 16
Income
Poverty
Unemployment
Labor Participation
Family Structure
Vehicle Availability
Education Level
Disability

Child Poverty Among Girls Under 16 Comparison

Whites/Caucasians

Austrians

Average
Exceptional
16.6%
CHILD POVERTY AMONG GIRLS UNDER 16
43.6/ 100
METRIC RATING
178th/ 347
METRIC RANK
14.9%
CHILD POVERTY AMONG GIRLS UNDER 16
96.7/ 100
METRIC RATING
92nd/ 347
METRIC RANK

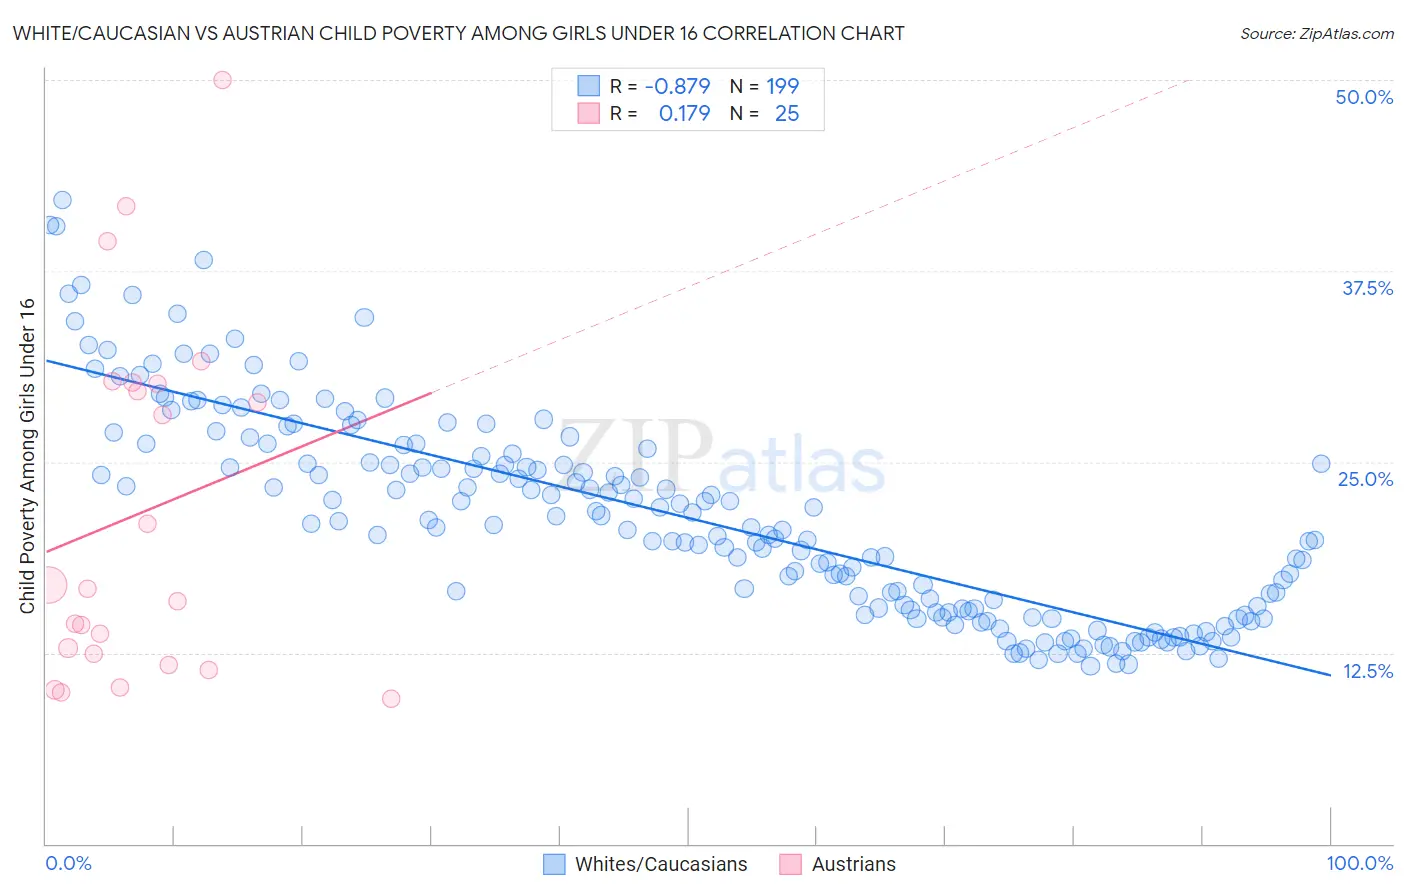
White/Caucasian vs Austrian Child Poverty Among Girls Under 16 Correlation Chart

The statistical analysis conducted on geographies consisting of 558,680,954 people shows a very strong negative correlation between the proportion of Whites/Caucasians and poverty level among girls under the age of 16 in the United States with a correlation coefficient (R) of -0.879 and weighted average of 16.6%. Similarly, the statistical analysis conducted on geographies consisting of 439,542,815 people shows a poor positive correlation between the proportion of Austrians and poverty level among girls under the age of 16 in the United States with a correlation coefficient (R) of 0.179 and weighted average of 14.9%, a difference of 11.5%.
White/Caucasian vs Austrian Child Poverty Among Girls Under 16

Child Poverty Among Girls Under 16 Correlation Summary

MeasurementWhite/CaucasianAustrian
Minimum11.7%9.5%
Maximum42.2%50.0%
Range30.5%40.5%
Mean21.4%21.6%
Median20.7%16.7%
Interquartile 25% (IQ1)15.2%12.1%
Interquartile 75% (IQ3)25.5%30.2%
Interquartile Range (IQR)10.3%18.1%
Standard Deviation (Sample)6.8%11.5%
Standard Deviation (Population)6.7%11.3%

Similar Demographics by Child Poverty Among Girls Under 16

Demographics Similar to Whites/Caucasians by Child Poverty Among Girls Under 16

In terms of child poverty among girls under 16, the demographic groups most similar to Whites/Caucasians are Hawaiian (16.6%, a difference of 0.030%), Immigrants from Syria (16.6%, a difference of 0.040%), Immigrants from Western Asia (16.6%, a difference of 0.060%), Immigrants from Iraq (16.6%, a difference of 0.060%), and Immigrants from Ethiopia (16.6%, a difference of 0.070%).
DemographicsRating | RankChild Poverty Among Girls Under 16
Immigrants | Saudi Arabia
64.0
/100
|
#171
Good
16.2%
Afghans
62.3
/100
|
#172
Good
16.2%
Immigrants | South America
55.1
/100
|
#173
Average
16.4%
Ethiopians
50.0
/100
|
#174
Average
16.5%
Lebanese
45.4
/100
|
#175
Average
16.6%
Hungarians
45.1
/100
|
#176
Average
16.6%
Immigrants | Western Asia
44.1
/100
|
#177
Average
16.6%
Whites/Caucasians
43.6
/100
|
#178
Average
16.6%
Hawaiians
43.4
/100
|
#179
Average
16.6%
Immigrants | Syria
43.3
/100
|
#180
Average
16.6%
Immigrants | Iraq
43.2
/100
|
#181
Average
16.6%
Immigrants | Ethiopia
43.1
/100
|
#182
Average
16.6%
Immigrants | Portugal
42.5
/100
|
#183
Average
16.6%
Scotch-Irish
39.6
/100
|
#184
Fair
16.7%
Immigrants | Uruguay
35.6
/100
|
#185
Fair
16.7%

Demographics Similar to Austrians by Child Poverty Among Girls Under 16

In terms of child poverty among girls under 16, the demographic groups most similar to Austrians are Immigrants from North America (14.9%, a difference of 0.070%), Immigrants from Switzerland (14.9%, a difference of 0.34%), Immigrants from Belarus (14.8%, a difference of 0.35%), German (14.9%, a difference of 0.36%), and Northern European (14.8%, a difference of 0.39%).
DemographicsRating | RankChild Poverty Among Girls Under 16
Swiss
97.2
/100
|
#85
Exceptional
14.8%
Australians
97.2
/100
|
#86
Exceptional
14.8%
Finns
97.2
/100
|
#87
Exceptional
14.8%
Immigrants | Canada
97.1
/100
|
#88
Exceptional
14.8%
Jordanians
97.1
/100
|
#89
Exceptional
14.8%
Northern Europeans
97.0
/100
|
#90
Exceptional
14.8%
Immigrants | Belarus
97.0
/100
|
#91
Exceptional
14.8%
Austrians
96.7
/100
|
#92
Exceptional
14.9%
Immigrants | North America
96.6
/100
|
#93
Exceptional
14.9%
Immigrants | Switzerland
96.3
/100
|
#94
Exceptional
14.9%
Germans
96.3
/100
|
#95
Exceptional
14.9%
Immigrants | France
96.2
/100
|
#96
Exceptional
14.9%
Immigrants | Latvia
96.1
/100
|
#97
Exceptional
14.9%
Basques
95.9
/100
|
#98
Exceptional
15.0%
Immigrants | Egypt
95.7
/100
|
#99
Exceptional
15.0%