Macedonian vs Immigrants from Lithuania Female Poverty
COMPARE
Macedonian
Immigrants from Lithuania
Female Poverty
Female Poverty Comparison
Macedonians
Immigrants from Lithuania
11.8%
FEMALE POVERTY
99.3/ 100
METRIC RATING
40th/ 347
METRIC RANK
11.3%
FEMALE POVERTY
99.9/ 100
METRIC RATING
13th/ 347
METRIC RANK
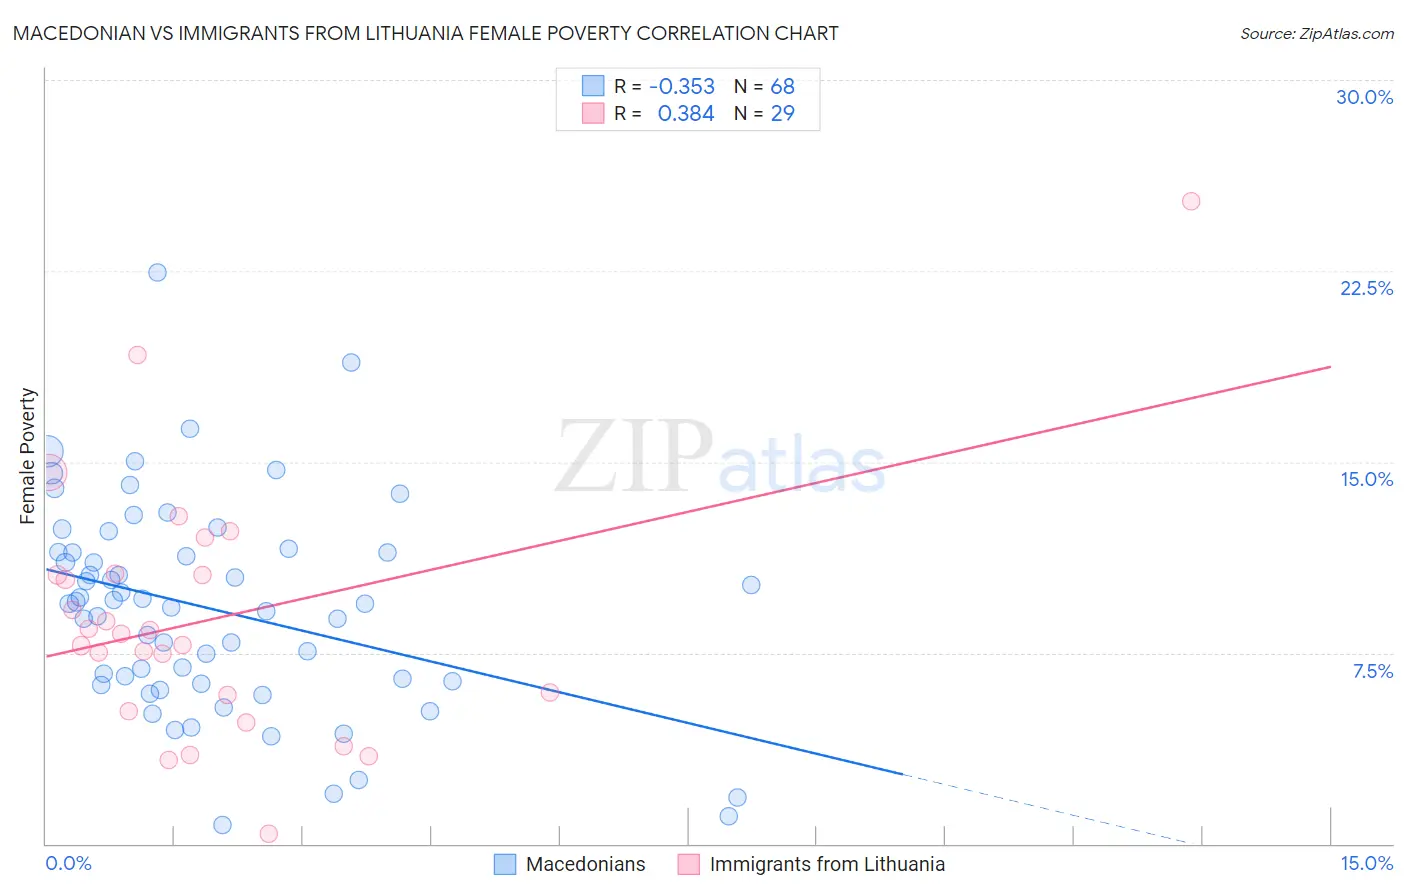
Macedonian vs Immigrants from Lithuania Female Poverty Correlation Chart
The statistical analysis conducted on geographies consisting of 132,594,768 people shows a mild negative correlation between the proportion of Macedonians and poverty level among females in the United States with a correlation coefficient (R) of -0.353 and weighted average of 11.8%. Similarly, the statistical analysis conducted on geographies consisting of 117,711,686 people shows a mild positive correlation between the proportion of Immigrants from Lithuania and poverty level among females in the United States with a correlation coefficient (R) of 0.384 and weighted average of 11.3%, a difference of 5.0%.
Female Poverty Correlation Summary
| Measurement | Macedonian | Immigrants from Lithuania |
| Minimum | 0.74% | 0.39% |
| Maximum | 22.4% | 25.2% |
| Range | 21.7% | 24.8% |
| Mean | 9.2% | 8.8% |
| Median | 9.4% | 8.3% |
| Interquartile 25% (IQ1) | 6.3% | 5.5% |
| Interquartile 75% (IQ3) | 11.5% | 10.6% |
| Interquartile Range (IQR) | 5.1% | 5.1% |
| Standard Deviation (Sample) | 4.1% | 5.0% |
| Standard Deviation (Population) | 4.1% | 4.9% |
Similar Demographics by Female Poverty
Demographics Similar to Macedonians by Female Poverty
In terms of female poverty, the demographic groups most similar to Macedonians are Immigrants from Poland (11.8%, a difference of 0.050%), Czech (11.9%, a difference of 0.18%), Immigrants from Moldova (11.9%, a difference of 0.18%), Korean (11.9%, a difference of 0.22%), and Russian (11.8%, a difference of 0.26%).
| Demographics | Rating | Rank | Female Poverty |
| Cypriots | 99.5 /100 | #33 | Exceptional 11.8% |
| Immigrants | Singapore | 99.4 /100 | #34 | Exceptional 11.8% |
| Immigrants | Iran | 99.4 /100 | #35 | Exceptional 11.8% |
| Immigrants | Pakistan | 99.4 /100 | #36 | Exceptional 11.8% |
| Immigrants | Greece | 99.3 /100 | #37 | Exceptional 11.8% |
| Russians | 99.3 /100 | #38 | Exceptional 11.8% |
| Immigrants | Poland | 99.3 /100 | #39 | Exceptional 11.8% |
| Macedonians | 99.3 /100 | #40 | Exceptional 11.8% |
| Czechs | 99.2 /100 | #41 | Exceptional 11.9% |
| Immigrants | Moldova | 99.2 /100 | #42 | Exceptional 11.9% |
| Koreans | 99.2 /100 | #43 | Exceptional 11.9% |
| Tongans | 99.2 /100 | #44 | Exceptional 11.9% |
| Immigrants | Czechoslovakia | 99.2 /100 | #45 | Exceptional 11.9% |
| Turks | 99.2 /100 | #46 | Exceptional 11.9% |
| Asians | 99.1 /100 | #47 | Exceptional 11.9% |
Demographics Similar to Immigrants from Lithuania by Female Poverty
In terms of female poverty, the demographic groups most similar to Immigrants from Lithuania are Bhutanese (11.3%, a difference of 0.010%), Maltese (11.2%, a difference of 0.47%), Immigrants from Hong Kong (11.2%, a difference of 0.58%), Lithuanian (11.4%, a difference of 0.96%), and Latvian (11.4%, a difference of 1.3%).
| Demographics | Rating | Rank | Female Poverty |
| Immigrants | Ireland | 99.9 /100 | #6 | Exceptional 11.0% |
| Assyrians/Chaldeans/Syriacs | 99.9 /100 | #7 | Exceptional 11.0% |
| Immigrants | South Central Asia | 99.9 /100 | #8 | Exceptional 11.1% |
| Bulgarians | 99.9 /100 | #9 | Exceptional 11.1% |
| Immigrants | Hong Kong | 99.9 /100 | #10 | Exceptional 11.2% |
| Maltese | 99.9 /100 | #11 | Exceptional 11.2% |
| Bhutanese | 99.9 /100 | #12 | Exceptional 11.3% |
| Immigrants | Lithuania | 99.9 /100 | #13 | Exceptional 11.3% |
| Lithuanians | 99.8 /100 | #14 | Exceptional 11.4% |
| Latvians | 99.8 /100 | #15 | Exceptional 11.4% |
| Immigrants | Bolivia | 99.8 /100 | #16 | Exceptional 11.5% |
| Bolivians | 99.8 /100 | #17 | Exceptional 11.5% |
| Immigrants | Scotland | 99.8 /100 | #18 | Exceptional 11.5% |
| Norwegians | 99.8 /100 | #19 | Exceptional 11.5% |
| Eastern Europeans | 99.7 /100 | #20 | Exceptional 11.5% |