Ecuadorian vs Immigrants from Lithuania Female Poverty
COMPARE
Ecuadorian
Immigrants from Lithuania
Female Poverty
Female Poverty Comparison
Ecuadorians
Immigrants from Lithuania
15.3%
FEMALE POVERTY
0.3/ 100
METRIC RATING
244th/ 347
METRIC RANK
11.3%
FEMALE POVERTY
99.9/ 100
METRIC RATING
13th/ 347
METRIC RANK
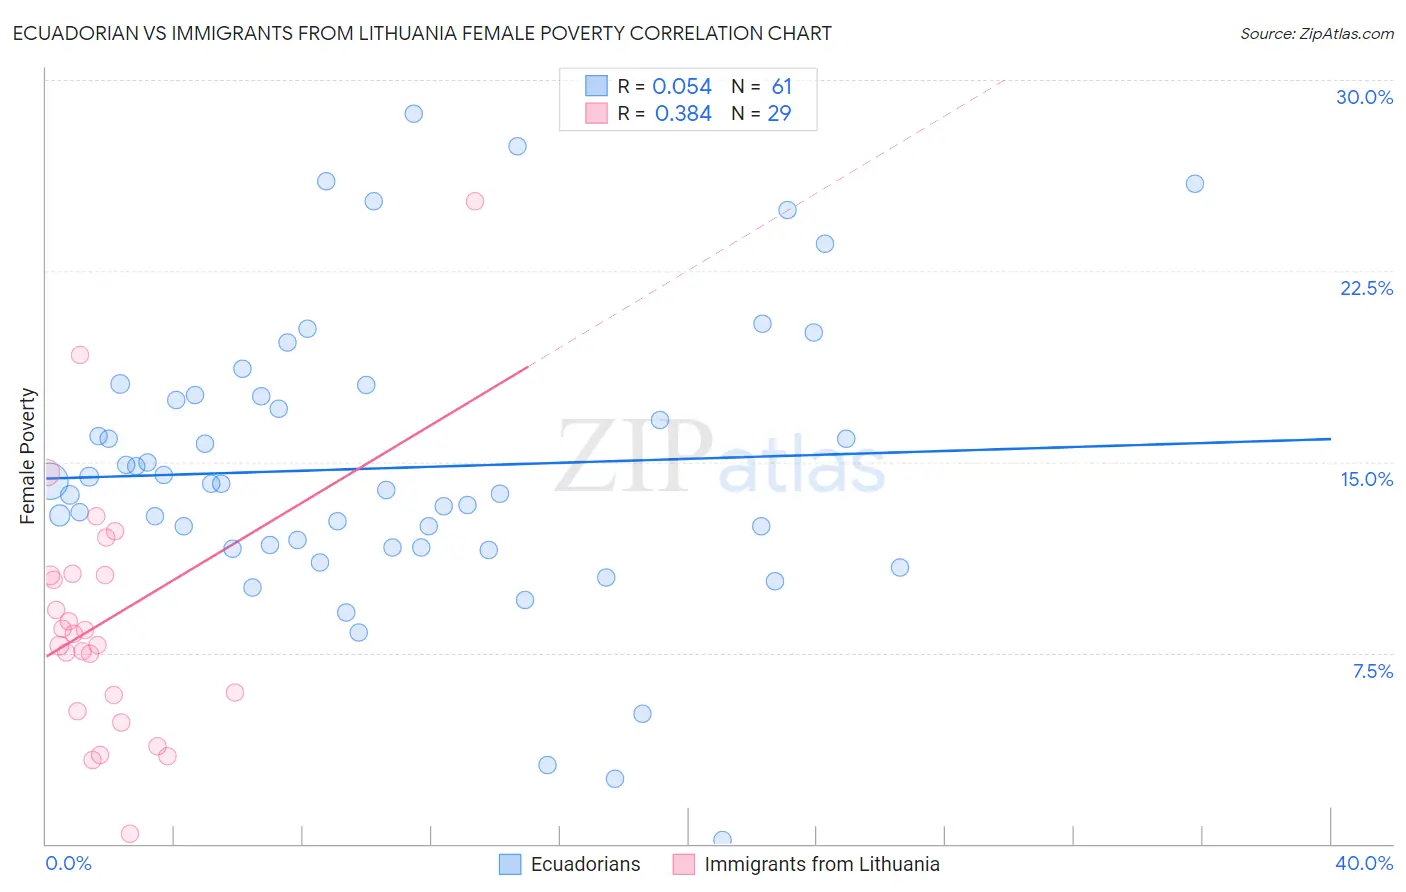
Ecuadorian vs Immigrants from Lithuania Female Poverty Correlation Chart
The statistical analysis conducted on geographies consisting of 317,585,196 people shows a slight positive correlation between the proportion of Ecuadorians and poverty level among females in the United States with a correlation coefficient (R) of 0.054 and weighted average of 15.3%. Similarly, the statistical analysis conducted on geographies consisting of 117,711,686 people shows a mild positive correlation between the proportion of Immigrants from Lithuania and poverty level among females in the United States with a correlation coefficient (R) of 0.384 and weighted average of 11.3%, a difference of 35.4%.
Female Poverty Correlation Summary
| Measurement | Ecuadorian | Immigrants from Lithuania |
| Minimum | 0.14% | 0.39% |
| Maximum | 28.7% | 25.2% |
| Range | 28.5% | 24.8% |
| Mean | 14.8% | 8.8% |
| Median | 14.1% | 8.3% |
| Interquartile 25% (IQ1) | 11.7% | 5.5% |
| Interquartile 75% (IQ3) | 17.6% | 10.6% |
| Interquartile Range (IQR) | 5.9% | 5.1% |
| Standard Deviation (Sample) | 5.7% | 5.0% |
| Standard Deviation (Population) | 5.7% | 4.9% |
Similar Demographics by Female Poverty
Demographics Similar to Ecuadorians by Female Poverty
In terms of female poverty, the demographic groups most similar to Ecuadorians are Nicaraguan (15.3%, a difference of 0.050%), Spanish American Indian (15.3%, a difference of 0.090%), Cuban (15.3%, a difference of 0.15%), Potawatomi (15.3%, a difference of 0.16%), and Immigrants from Ghana (15.3%, a difference of 0.16%).
| Demographics | Rating | Rank | Female Poverty |
| French American Indians | 0.6 /100 | #237 | Tragic 15.1% |
| Immigrants | Armenia | 0.6 /100 | #238 | Tragic 15.1% |
| Immigrants | Middle Africa | 0.5 /100 | #239 | Tragic 15.2% |
| Sudanese | 0.5 /100 | #240 | Tragic 15.2% |
| Immigrants | Sudan | 0.4 /100 | #241 | Tragic 15.2% |
| Nepalese | 0.4 /100 | #242 | Tragic 15.2% |
| Nicaraguans | 0.3 /100 | #243 | Tragic 15.3% |
| Ecuadorians | 0.3 /100 | #244 | Tragic 15.3% |
| Spanish American Indians | 0.3 /100 | #245 | Tragic 15.3% |
| Cubans | 0.3 /100 | #246 | Tragic 15.3% |
| Potawatomi | 0.3 /100 | #247 | Tragic 15.3% |
| Immigrants | Ghana | 0.3 /100 | #248 | Tragic 15.3% |
| Salvadorans | 0.3 /100 | #249 | Tragic 15.3% |
| Immigrants | Western Africa | 0.3 /100 | #250 | Tragic 15.3% |
| Immigrants | Trinidad and Tobago | 0.3 /100 | #251 | Tragic 15.4% |
Demographics Similar to Immigrants from Lithuania by Female Poverty
In terms of female poverty, the demographic groups most similar to Immigrants from Lithuania are Bhutanese (11.3%, a difference of 0.010%), Maltese (11.2%, a difference of 0.47%), Immigrants from Hong Kong (11.2%, a difference of 0.58%), Lithuanian (11.4%, a difference of 0.96%), and Latvian (11.4%, a difference of 1.3%).
| Demographics | Rating | Rank | Female Poverty |
| Immigrants | Ireland | 99.9 /100 | #6 | Exceptional 11.0% |
| Assyrians/Chaldeans/Syriacs | 99.9 /100 | #7 | Exceptional 11.0% |
| Immigrants | South Central Asia | 99.9 /100 | #8 | Exceptional 11.1% |
| Bulgarians | 99.9 /100 | #9 | Exceptional 11.1% |
| Immigrants | Hong Kong | 99.9 /100 | #10 | Exceptional 11.2% |
| Maltese | 99.9 /100 | #11 | Exceptional 11.2% |
| Bhutanese | 99.9 /100 | #12 | Exceptional 11.3% |
| Immigrants | Lithuania | 99.9 /100 | #13 | Exceptional 11.3% |
| Lithuanians | 99.8 /100 | #14 | Exceptional 11.4% |
| Latvians | 99.8 /100 | #15 | Exceptional 11.4% |
| Immigrants | Bolivia | 99.8 /100 | #16 | Exceptional 11.5% |
| Bolivians | 99.8 /100 | #17 | Exceptional 11.5% |
| Immigrants | Scotland | 99.8 /100 | #18 | Exceptional 11.5% |
| Norwegians | 99.8 /100 | #19 | Exceptional 11.5% |
| Eastern Europeans | 99.7 /100 | #20 | Exceptional 11.5% |