Cape Verdean vs European Single Female Poverty
COMPARE
Cape Verdean
European
Single Female Poverty
Single Female Poverty Comparison
Cape Verdeans
Europeans
22.3%
SINGLE FEMALE POVERTY
2.1/ 100
METRIC RATING
241st/ 347
METRIC RANK
21.1%
SINGLE FEMALE POVERTY
42.3/ 100
METRIC RATING
181st/ 347
METRIC RANK
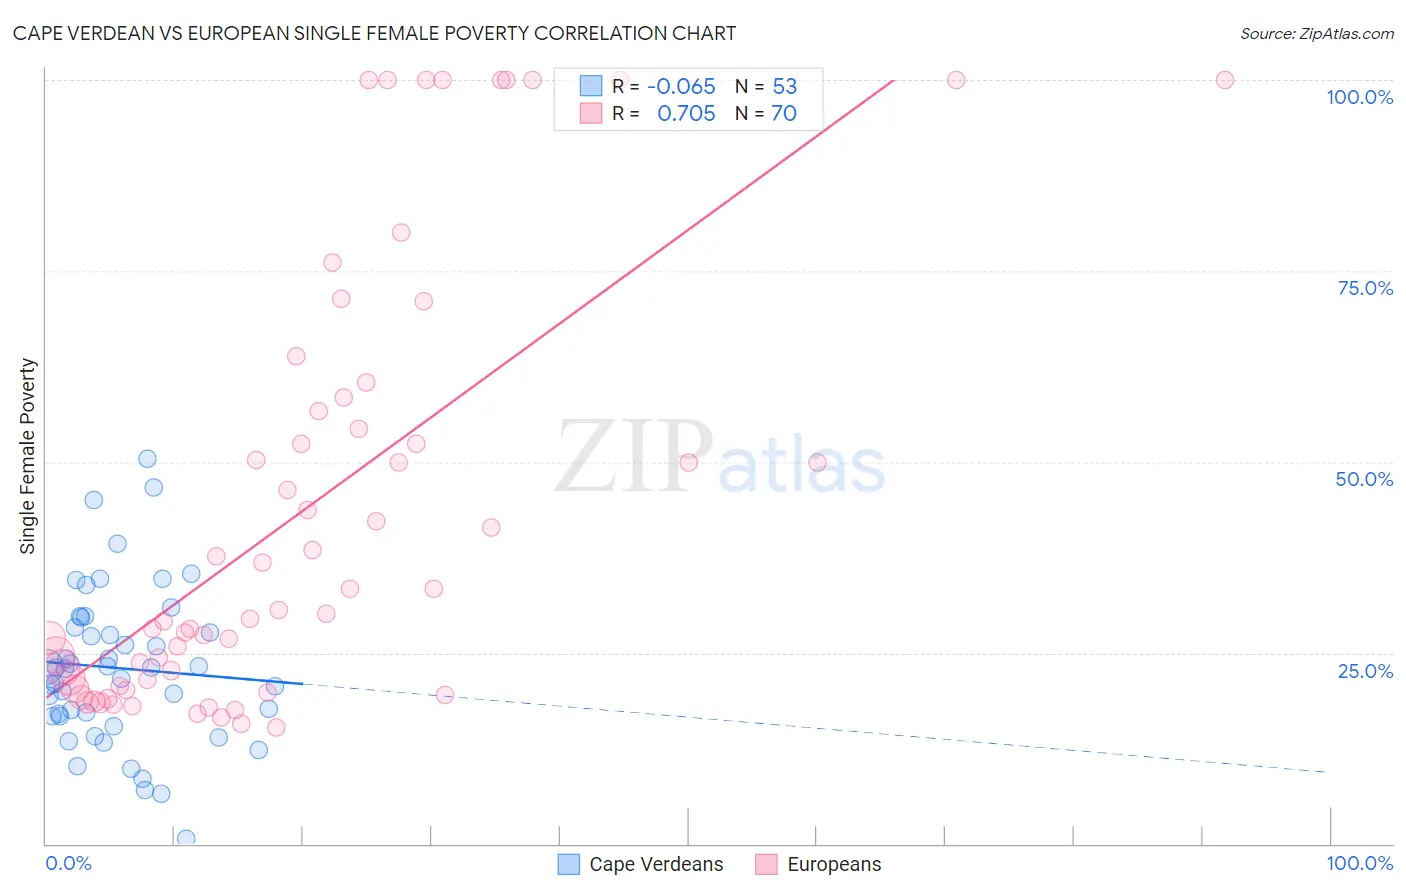
Cape Verdean vs European Single Female Poverty Correlation Chart
The statistical analysis conducted on geographies consisting of 107,029,522 people shows a slight negative correlation between the proportion of Cape Verdeans and poverty level among single females in the United States with a correlation coefficient (R) of -0.065 and weighted average of 22.3%. Similarly, the statistical analysis conducted on geographies consisting of 543,036,354 people shows a strong positive correlation between the proportion of Europeans and poverty level among single females in the United States with a correlation coefficient (R) of 0.705 and weighted average of 21.1%, a difference of 5.5%.
Single Female Poverty Correlation Summary
| Measurement | Cape Verdean | European |
| Minimum | 0.66% | 15.3% |
| Maximum | 50.5% | 100.0% |
| Range | 49.8% | 84.7% |
| Mean | 23.0% | 43.6% |
| Median | 23.1% | 30.4% |
| Interquartile 25% (IQ1) | 16.7% | 20.6% |
| Interquartile 75% (IQ3) | 28.9% | 56.6% |
| Interquartile Range (IQR) | 12.2% | 36.0% |
| Standard Deviation (Sample) | 10.2% | 28.1% |
| Standard Deviation (Population) | 10.1% | 27.9% |
Similar Demographics by Single Female Poverty
Demographics Similar to Cape Verdeans by Single Female Poverty
In terms of single female poverty, the demographic groups most similar to Cape Verdeans are Bermudan (22.3%, a difference of 0.070%), French (22.2%, a difference of 0.14%), West Indian (22.3%, a difference of 0.16%), Immigrants from Middle Africa (22.3%, a difference of 0.17%), and Immigrants from Bangladesh (22.3%, a difference of 0.21%).
| Demographics | Rating | Rank | Single Female Poverty |
| Spanish | 4.7 /100 | #234 | Tragic 22.0% |
| Dutch | 4.6 /100 | #235 | Tragic 22.0% |
| Immigrants | Ecuador | 4.2 /100 | #236 | Tragic 22.0% |
| Vietnamese | 4.0 /100 | #237 | Tragic 22.0% |
| French Canadians | 2.8 /100 | #238 | Tragic 22.2% |
| Malaysians | 2.8 /100 | #239 | Tragic 22.2% |
| French | 2.3 /100 | #240 | Tragic 22.2% |
| Cape Verdeans | 2.1 /100 | #241 | Tragic 22.3% |
| Bermudans | 2.0 /100 | #242 | Tragic 22.3% |
| West Indians | 1.9 /100 | #243 | Tragic 22.3% |
| Immigrants | Middle Africa | 1.9 /100 | #244 | Tragic 22.3% |
| Immigrants | Bangladesh | 1.8 /100 | #245 | Tragic 22.3% |
| Liberians | 1.4 /100 | #246 | Tragic 22.4% |
| Immigrants | El Salvador | 1.4 /100 | #247 | Tragic 22.4% |
| Belizeans | 1.4 /100 | #248 | Tragic 22.4% |
Demographics Similar to Europeans by Single Female Poverty
In terms of single female poverty, the demographic groups most similar to Europeans are Spanish American Indian (21.1%, a difference of 0.010%), British (21.1%, a difference of 0.040%), Slavic (21.1%, a difference of 0.12%), Immigrants from Bosnia and Herzegovina (21.1%, a difference of 0.16%), and Slovak (21.1%, a difference of 0.17%).
| Demographics | Rating | Rank | Single Female Poverty |
| Cubans | 50.0 /100 | #174 | Average 21.0% |
| Czechs | 46.8 /100 | #175 | Average 21.0% |
| Canadians | 45.4 /100 | #176 | Average 21.1% |
| Scandinavians | 45.2 /100 | #177 | Average 21.1% |
| Immigrants | Bosnia and Herzegovina | 44.9 /100 | #178 | Average 21.1% |
| British | 42.9 /100 | #179 | Average 21.1% |
| Spanish American Indians | 42.5 /100 | #180 | Average 21.1% |
| Europeans | 42.3 /100 | #181 | Average 21.1% |
| Slavs | 40.5 /100 | #182 | Average 21.1% |
| Slovaks | 39.7 /100 | #183 | Fair 21.1% |
| Hungarians | 39.6 /100 | #184 | Fair 21.1% |
| Immigrants | Cambodia | 38.2 /100 | #185 | Fair 21.2% |
| Hawaiians | 37.7 /100 | #186 | Fair 21.2% |
| Immigrants | Nigeria | 36.8 /100 | #187 | Fair 21.2% |
| Yugoslavians | 35.4 /100 | #188 | Fair 21.2% |