Tlingit-Haida vs Immigrants from Poland Single Father Poverty
COMPARE
Tlingit-Haida
Immigrants from Poland
Single Father Poverty
Single Father Poverty Comparison
Tlingit-Haida
Immigrants from Poland
15.3%
SINGLE FATHER POVERTY
99.5/ 100
METRIC RATING
78th/ 347
METRIC RANK
15.7%
SINGLE FATHER POVERTY
95.8/ 100
METRIC RATING
106th/ 347
METRIC RANK
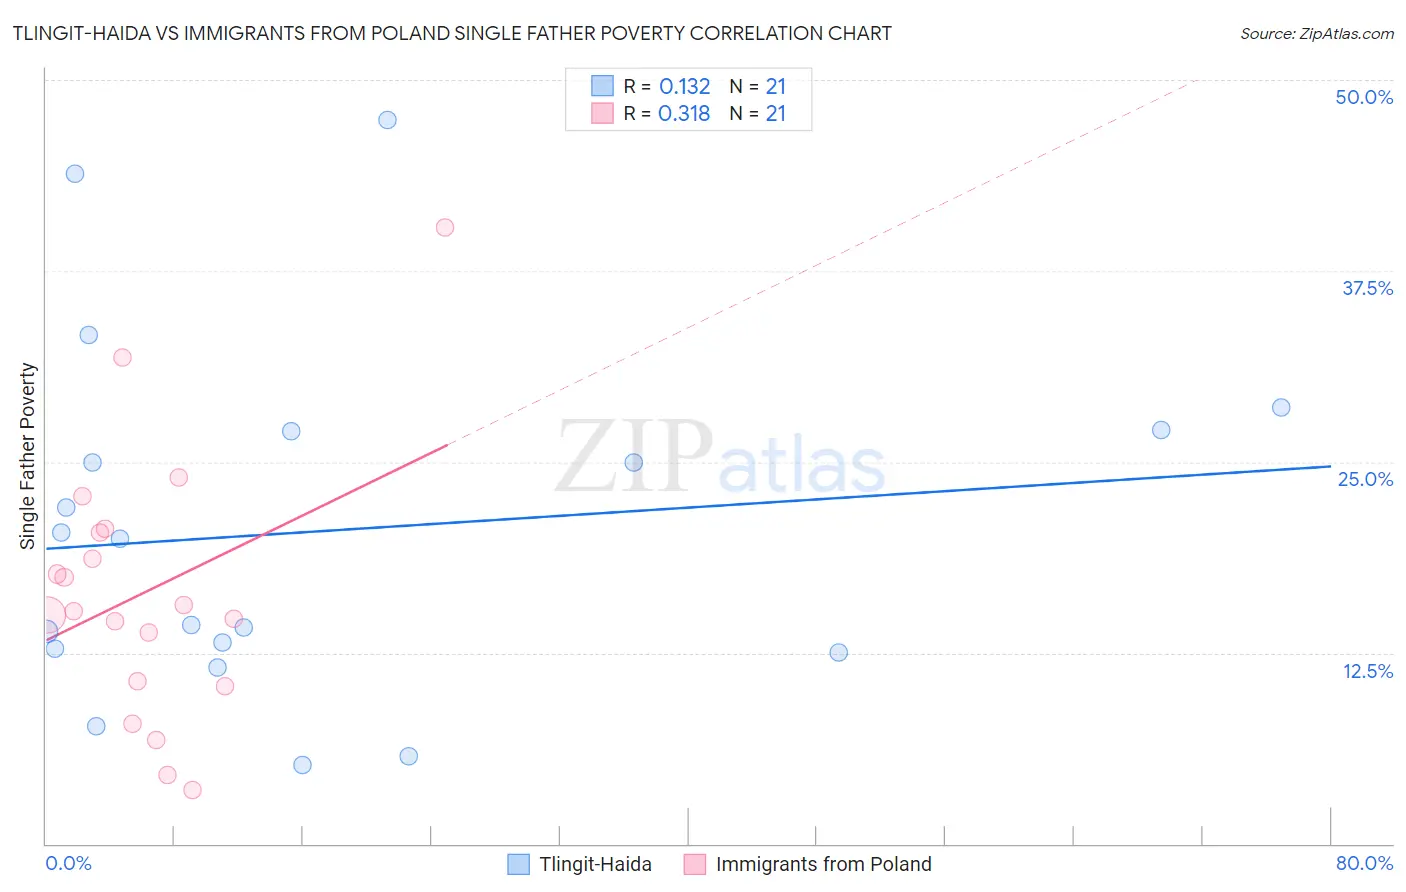
Tlingit-Haida vs Immigrants from Poland Single Father Poverty Correlation Chart
The statistical analysis conducted on geographies consisting of 55,978,156 people shows a poor positive correlation between the proportion of Tlingit-Haida and poverty level among single fathers in the United States with a correlation coefficient (R) of 0.132 and weighted average of 15.3%. Similarly, the statistical analysis conducted on geographies consisting of 239,246,300 people shows a mild positive correlation between the proportion of Immigrants from Poland and poverty level among single fathers in the United States with a correlation coefficient (R) of 0.318 and weighted average of 15.7%, a difference of 2.5%.
Single Father Poverty Correlation Summary
| Measurement | Tlingit-Haida | Immigrants from Poland |
| Minimum | 5.1% | 3.5% |
| Maximum | 47.4% | 40.3% |
| Range | 42.2% | 36.8% |
| Mean | 20.5% | 16.5% |
| Median | 20.0% | 15.2% |
| Interquartile 25% (IQ1) | 12.6% | 10.5% |
| Interquartile 75% (IQ3) | 27.1% | 20.5% |
| Interquartile Range (IQR) | 14.4% | 10.0% |
| Standard Deviation (Sample) | 11.5% | 8.7% |
| Standard Deviation (Population) | 11.2% | 8.5% |
Similar Demographics by Single Father Poverty
Demographics Similar to Tlingit-Haida by Single Father Poverty
In terms of single father poverty, the demographic groups most similar to Tlingit-Haida are Immigrants from Northern Africa (15.3%, a difference of 0.020%), Immigrants from Peru (15.3%, a difference of 0.050%), Immigrants from Japan (15.3%, a difference of 0.060%), Immigrants from Turkey (15.3%, a difference of 0.14%), and Maltese (15.3%, a difference of 0.16%).
| Demographics | Rating | Rank | Single Father Poverty |
| Immigrants | Brazil | 99.6 /100 | #71 | Exceptional 15.3% |
| Immigrants | Lithuania | 99.6 /100 | #72 | Exceptional 15.3% |
| Kenyans | 99.6 /100 | #73 | Exceptional 15.3% |
| Maltese | 99.6 /100 | #74 | Exceptional 15.3% |
| Immigrants | Turkey | 99.5 /100 | #75 | Exceptional 15.3% |
| Immigrants | Japan | 99.5 /100 | #76 | Exceptional 15.3% |
| Immigrants | Peru | 99.5 /100 | #77 | Exceptional 15.3% |
| Tlingit-Haida | 99.5 /100 | #78 | Exceptional 15.3% |
| Immigrants | Northern Africa | 99.5 /100 | #79 | Exceptional 15.3% |
| Armenians | 99.4 /100 | #80 | Exceptional 15.4% |
| Immigrants | Congo | 99.4 /100 | #81 | Exceptional 15.4% |
| Immigrants | Ukraine | 99.4 /100 | #82 | Exceptional 15.4% |
| Chinese | 99.3 /100 | #83 | Exceptional 15.4% |
| Peruvians | 99.2 /100 | #84 | Exceptional 15.4% |
| Immigrants | Oceania | 99.1 /100 | #85 | Exceptional 15.4% |
Demographics Similar to Immigrants from Poland by Single Father Poverty
In terms of single father poverty, the demographic groups most similar to Immigrants from Poland are Native Hawaiian (15.7%, a difference of 0.020%), Pakistani (15.7%, a difference of 0.030%), Immigrants from Australia (15.7%, a difference of 0.070%), Australian (15.7%, a difference of 0.080%), and South American Indian (15.7%, a difference of 0.11%).
| Demographics | Rating | Rank | Single Father Poverty |
| Immigrants | Middle Africa | 97.4 /100 | #99 | Exceptional 15.6% |
| Immigrants | Chile | 96.9 /100 | #100 | Exceptional 15.7% |
| Fijians | 96.8 /100 | #101 | Exceptional 15.7% |
| Chileans | 96.4 /100 | #102 | Exceptional 15.7% |
| South American Indians | 96.2 /100 | #103 | Exceptional 15.7% |
| Australians | 96.1 /100 | #104 | Exceptional 15.7% |
| Immigrants | Australia | 96.1 /100 | #105 | Exceptional 15.7% |
| Immigrants | Poland | 95.8 /100 | #106 | Exceptional 15.7% |
| Native Hawaiians | 95.8 /100 | #107 | Exceptional 15.7% |
| Pakistanis | 95.7 /100 | #108 | Exceptional 15.7% |
| Turks | 95.1 /100 | #109 | Exceptional 15.8% |
| Immigrants | Africa | 95.1 /100 | #110 | Exceptional 15.8% |
| Bulgarians | 94.8 /100 | #111 | Exceptional 15.8% |
| Immigrants | Latvia | 94.7 /100 | #112 | Exceptional 15.8% |
| Danes | 94.5 /100 | #113 | Exceptional 15.8% |