Tlingit-Haida vs Alaska Native Single Father Poverty
COMPARE
Tlingit-Haida
Alaska Native
Single Father Poverty
Single Father Poverty Comparison
Tlingit-Haida
Alaska Natives
15.3%
SINGLE FATHER POVERTY
99.5/ 100
METRIC RATING
78th/ 347
METRIC RANK
18.1%
SINGLE FATHER POVERTY
0.0/ 100
METRIC RATING
293rd/ 347
METRIC RANK
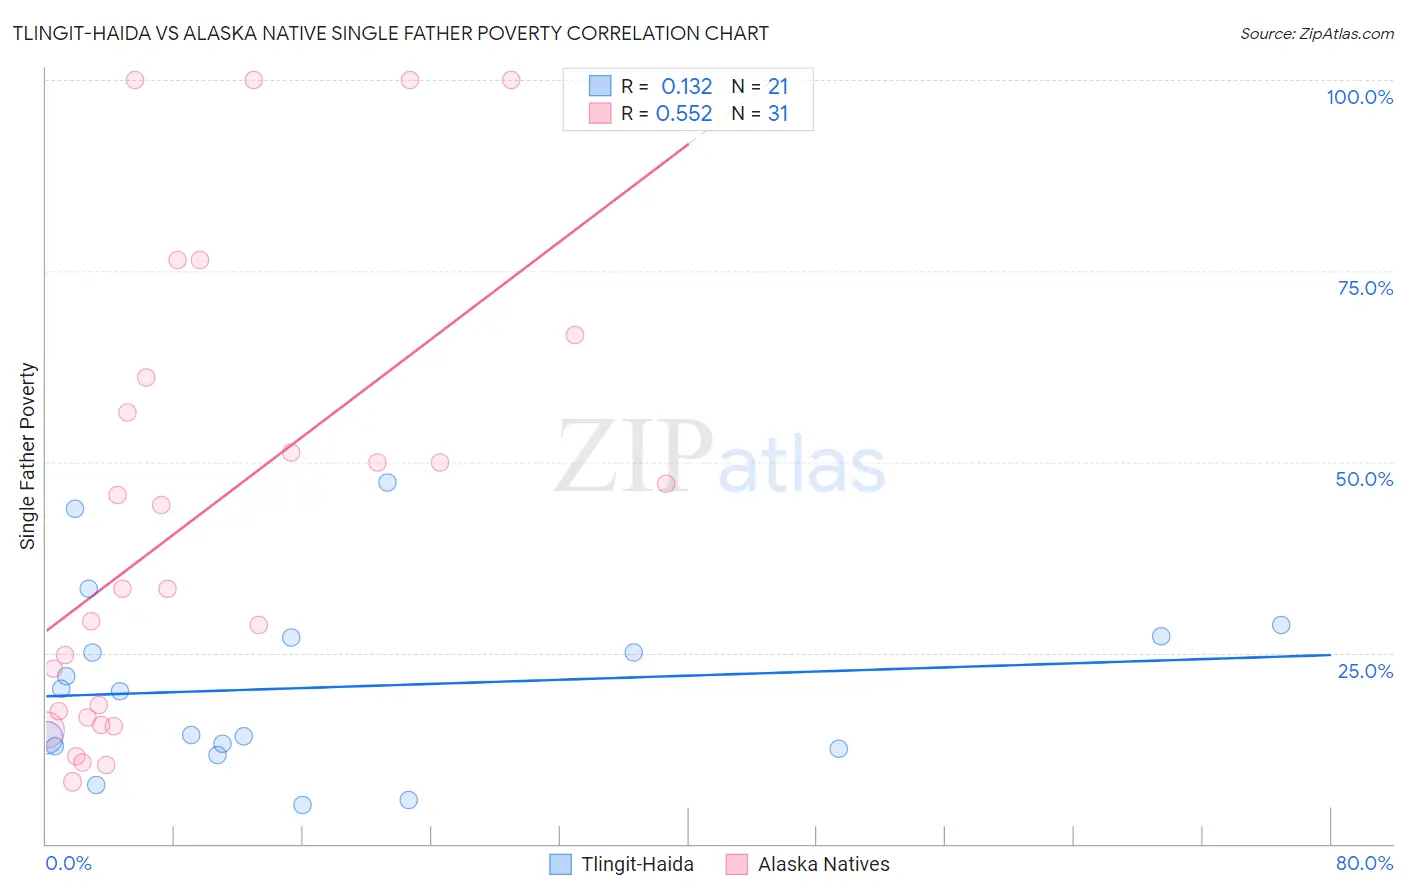
Tlingit-Haida vs Alaska Native Single Father Poverty Correlation Chart
The statistical analysis conducted on geographies consisting of 55,978,156 people shows a poor positive correlation between the proportion of Tlingit-Haida and poverty level among single fathers in the United States with a correlation coefficient (R) of 0.132 and weighted average of 15.3%. Similarly, the statistical analysis conducted on geographies consisting of 71,846,499 people shows a substantial positive correlation between the proportion of Alaska Natives and poverty level among single fathers in the United States with a correlation coefficient (R) of 0.552 and weighted average of 18.1%, a difference of 18.0%.
Single Father Poverty Correlation Summary
| Measurement | Tlingit-Haida | Alaska Native |
| Minimum | 5.1% | 8.1% |
| Maximum | 47.4% | 100.0% |
| Range | 42.2% | 91.9% |
| Mean | 20.5% | 43.1% |
| Median | 20.0% | 33.3% |
| Interquartile 25% (IQ1) | 12.6% | 16.6% |
| Interquartile 75% (IQ3) | 27.1% | 61.0% |
| Interquartile Range (IQR) | 14.4% | 44.4% |
| Standard Deviation (Sample) | 11.5% | 29.7% |
| Standard Deviation (Population) | 11.2% | 29.2% |
Similar Demographics by Single Father Poverty
Demographics Similar to Tlingit-Haida by Single Father Poverty
In terms of single father poverty, the demographic groups most similar to Tlingit-Haida are Immigrants from Northern Africa (15.3%, a difference of 0.020%), Immigrants from Peru (15.3%, a difference of 0.050%), Immigrants from Japan (15.3%, a difference of 0.060%), Immigrants from Turkey (15.3%, a difference of 0.14%), and Maltese (15.3%, a difference of 0.16%).
| Demographics | Rating | Rank | Single Father Poverty |
| Immigrants | Brazil | 99.6 /100 | #71 | Exceptional 15.3% |
| Immigrants | Lithuania | 99.6 /100 | #72 | Exceptional 15.3% |
| Kenyans | 99.6 /100 | #73 | Exceptional 15.3% |
| Maltese | 99.6 /100 | #74 | Exceptional 15.3% |
| Immigrants | Turkey | 99.5 /100 | #75 | Exceptional 15.3% |
| Immigrants | Japan | 99.5 /100 | #76 | Exceptional 15.3% |
| Immigrants | Peru | 99.5 /100 | #77 | Exceptional 15.3% |
| Tlingit-Haida | 99.5 /100 | #78 | Exceptional 15.3% |
| Immigrants | Northern Africa | 99.5 /100 | #79 | Exceptional 15.3% |
| Armenians | 99.4 /100 | #80 | Exceptional 15.4% |
| Immigrants | Congo | 99.4 /100 | #81 | Exceptional 15.4% |
| Immigrants | Ukraine | 99.4 /100 | #82 | Exceptional 15.4% |
| Chinese | 99.3 /100 | #83 | Exceptional 15.4% |
| Peruvians | 99.2 /100 | #84 | Exceptional 15.4% |
| Immigrants | Oceania | 99.1 /100 | #85 | Exceptional 15.4% |
Demographics Similar to Alaska Natives by Single Father Poverty
In terms of single father poverty, the demographic groups most similar to Alaska Natives are U.S. Virgin Islander (18.1%, a difference of 0.030%), Yakama (18.1%, a difference of 0.090%), Immigrants from Bahamas (18.1%, a difference of 0.11%), Alaskan Athabascan (18.1%, a difference of 0.12%), and Seminole (18.1%, a difference of 0.19%).
| Demographics | Rating | Rank | Single Father Poverty |
| Immigrants | North Macedonia | 0.0 /100 | #286 | Tragic 17.9% |
| Carpatho Rusyns | 0.0 /100 | #287 | Tragic 18.0% |
| Bahamians | 0.0 /100 | #288 | Tragic 18.0% |
| Irish | 0.0 /100 | #289 | Tragic 18.0% |
| West Indians | 0.0 /100 | #290 | Tragic 18.0% |
| Alaskan Athabascans | 0.0 /100 | #291 | Tragic 18.1% |
| Immigrants | Bahamas | 0.0 /100 | #292 | Tragic 18.1% |
| Alaska Natives | 0.0 /100 | #293 | Tragic 18.1% |
| U.S. Virgin Islanders | 0.0 /100 | #294 | Tragic 18.1% |
| Yakama | 0.0 /100 | #295 | Tragic 18.1% |
| Seminole | 0.0 /100 | #296 | Tragic 18.1% |
| French | 0.0 /100 | #297 | Tragic 18.2% |
| Africans | 0.0 /100 | #298 | Tragic 18.3% |
| Whites/Caucasians | 0.0 /100 | #299 | Tragic 18.4% |
| Immigrants | Dominican Republic | 0.0 /100 | #300 | Tragic 18.4% |