Tlingit-Haida vs Soviet Union Single Father Poverty
COMPARE
Tlingit-Haida
Soviet Union
Single Father Poverty
Single Father Poverty Comparison
Tlingit-Haida
Soviet Union
15.3%
SINGLE FATHER POVERTY
99.5/ 100
METRIC RATING
78th/ 347
METRIC RANK
14.3%
SINGLE FATHER POVERTY
100.0/ 100
METRIC RATING
18th/ 347
METRIC RANK
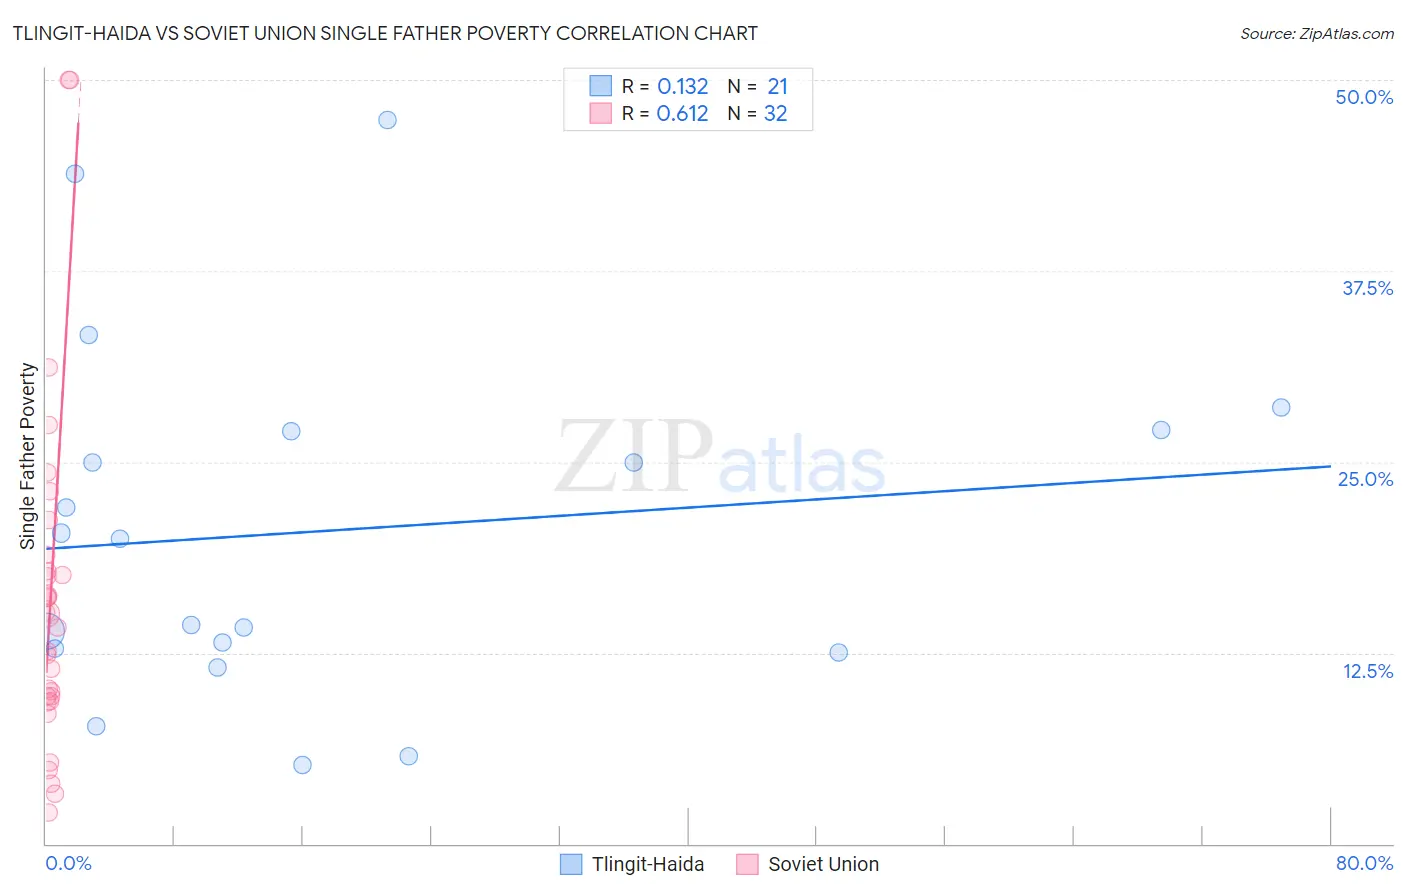
Tlingit-Haida vs Soviet Union Single Father Poverty Correlation Chart
The statistical analysis conducted on geographies consisting of 55,978,156 people shows a poor positive correlation between the proportion of Tlingit-Haida and poverty level among single fathers in the United States with a correlation coefficient (R) of 0.132 and weighted average of 15.3%. Similarly, the statistical analysis conducted on geographies consisting of 41,440,473 people shows a significant positive correlation between the proportion of Soviet Union and poverty level among single fathers in the United States with a correlation coefficient (R) of 0.612 and weighted average of 14.3%, a difference of 7.7%.
Single Father Poverty Correlation Summary
| Measurement | Tlingit-Haida | Soviet Union |
| Minimum | 5.1% | 2.1% |
| Maximum | 47.4% | 50.0% |
| Range | 42.2% | 47.9% |
| Mean | 20.5% | 16.1% |
| Median | 20.0% | 14.6% |
| Interquartile 25% (IQ1) | 12.6% | 9.5% |
| Interquartile 75% (IQ3) | 27.1% | 18.4% |
| Interquartile Range (IQR) | 14.4% | 8.9% |
| Standard Deviation (Sample) | 11.5% | 11.2% |
| Standard Deviation (Population) | 11.2% | 11.1% |
Similar Demographics by Single Father Poverty
Demographics Similar to Tlingit-Haida by Single Father Poverty
In terms of single father poverty, the demographic groups most similar to Tlingit-Haida are Immigrants from Northern Africa (15.3%, a difference of 0.020%), Immigrants from Peru (15.3%, a difference of 0.050%), Immigrants from Japan (15.3%, a difference of 0.060%), Immigrants from Turkey (15.3%, a difference of 0.14%), and Maltese (15.3%, a difference of 0.16%).
| Demographics | Rating | Rank | Single Father Poverty |
| Immigrants | Brazil | 99.6 /100 | #71 | Exceptional 15.3% |
| Immigrants | Lithuania | 99.6 /100 | #72 | Exceptional 15.3% |
| Kenyans | 99.6 /100 | #73 | Exceptional 15.3% |
| Maltese | 99.6 /100 | #74 | Exceptional 15.3% |
| Immigrants | Turkey | 99.5 /100 | #75 | Exceptional 15.3% |
| Immigrants | Japan | 99.5 /100 | #76 | Exceptional 15.3% |
| Immigrants | Peru | 99.5 /100 | #77 | Exceptional 15.3% |
| Tlingit-Haida | 99.5 /100 | #78 | Exceptional 15.3% |
| Immigrants | Northern Africa | 99.5 /100 | #79 | Exceptional 15.3% |
| Armenians | 99.4 /100 | #80 | Exceptional 15.4% |
| Immigrants | Congo | 99.4 /100 | #81 | Exceptional 15.4% |
| Immigrants | Ukraine | 99.4 /100 | #82 | Exceptional 15.4% |
| Chinese | 99.3 /100 | #83 | Exceptional 15.4% |
| Peruvians | 99.2 /100 | #84 | Exceptional 15.4% |
| Immigrants | Oceania | 99.1 /100 | #85 | Exceptional 15.4% |
Demographics Similar to Soviet Union by Single Father Poverty
In terms of single father poverty, the demographic groups most similar to Soviet Union are Immigrants from Hong Kong (14.2%, a difference of 0.030%), Immigrants from Iraq (14.3%, a difference of 0.040%), Immigrants from Singapore (14.3%, a difference of 0.090%), Immigrants from Afghanistan (14.3%, a difference of 0.18%), and Immigrants from Iran (14.2%, a difference of 0.48%).
| Demographics | Rating | Rank | Single Father Poverty |
| Filipinos | 100.0 /100 | #11 | Exceptional 14.0% |
| Immigrants | India | 100.0 /100 | #12 | Exceptional 14.0% |
| Immigrants | Philippines | 100.0 /100 | #13 | Exceptional 14.0% |
| Immigrants | Vietnam | 100.0 /100 | #14 | Exceptional 14.1% |
| Sri Lankans | 100.0 /100 | #15 | Exceptional 14.2% |
| Immigrants | Iran | 100.0 /100 | #16 | Exceptional 14.2% |
| Immigrants | Hong Kong | 100.0 /100 | #17 | Exceptional 14.2% |
| Soviet Union | 100.0 /100 | #18 | Exceptional 14.3% |
| Immigrants | Iraq | 100.0 /100 | #19 | Exceptional 14.3% |
| Immigrants | Singapore | 100.0 /100 | #20 | Exceptional 14.3% |
| Immigrants | Afghanistan | 100.0 /100 | #21 | Exceptional 14.3% |
| Taiwanese | 100.0 /100 | #22 | Exceptional 14.3% |
| Immigrants | Egypt | 100.0 /100 | #23 | Exceptional 14.4% |
| Immigrants | South Eastern Asia | 100.0 /100 | #24 | Exceptional 14.4% |
| Iranians | 100.0 /100 | #25 | Exceptional 14.4% |