Tlingit-Haida vs Immigrants from Albania Single Father Poverty
COMPARE
Tlingit-Haida
Immigrants from Albania
Single Father Poverty
Single Father Poverty Comparison
Tlingit-Haida
Immigrants from Albania
15.3%
SINGLE FATHER POVERTY
99.5/ 100
METRIC RATING
78th/ 347
METRIC RANK
17.2%
SINGLE FATHER POVERTY
0.7/ 100
METRIC RATING
257th/ 347
METRIC RANK
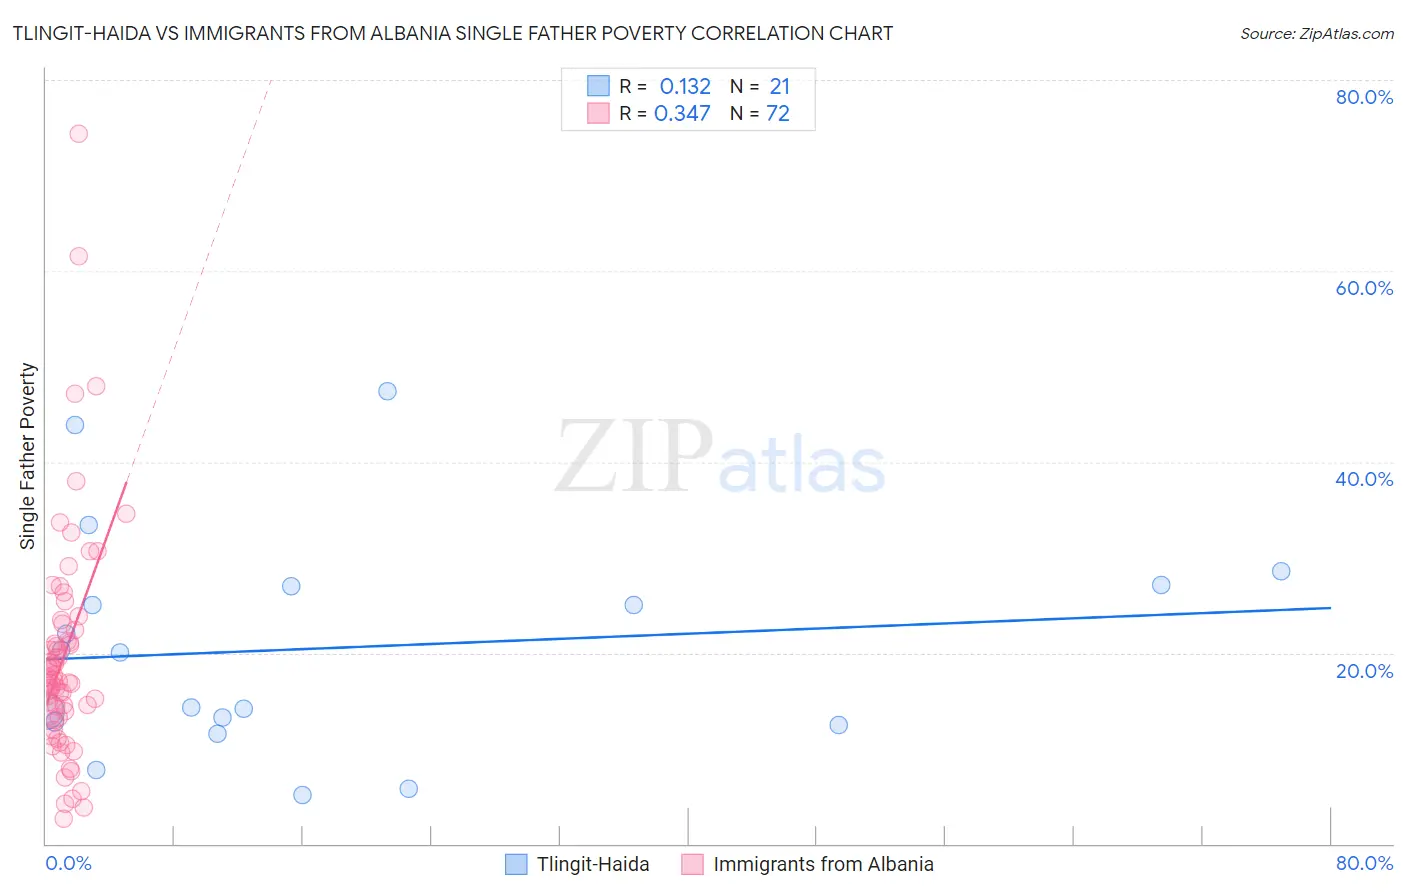
Tlingit-Haida vs Immigrants from Albania Single Father Poverty Correlation Chart
The statistical analysis conducted on geographies consisting of 55,978,156 people shows a poor positive correlation between the proportion of Tlingit-Haida and poverty level among single fathers in the United States with a correlation coefficient (R) of 0.132 and weighted average of 15.3%. Similarly, the statistical analysis conducted on geographies consisting of 101,642,932 people shows a mild positive correlation between the proportion of Immigrants from Albania and poverty level among single fathers in the United States with a correlation coefficient (R) of 0.347 and weighted average of 17.2%, a difference of 12.0%.
Single Father Poverty Correlation Summary
| Measurement | Tlingit-Haida | Immigrants from Albania |
| Minimum | 5.1% | 2.6% |
| Maximum | 47.4% | 74.4% |
| Range | 42.2% | 71.7% |
| Mean | 20.5% | 19.8% |
| Median | 20.0% | 17.1% |
| Interquartile 25% (IQ1) | 12.6% | 13.5% |
| Interquartile 75% (IQ3) | 27.1% | 22.7% |
| Interquartile Range (IQR) | 14.4% | 9.2% |
| Standard Deviation (Sample) | 11.5% | 12.2% |
| Standard Deviation (Population) | 11.2% | 12.1% |
Similar Demographics by Single Father Poverty
Demographics Similar to Tlingit-Haida by Single Father Poverty
In terms of single father poverty, the demographic groups most similar to Tlingit-Haida are Immigrants from Northern Africa (15.3%, a difference of 0.020%), Immigrants from Peru (15.3%, a difference of 0.050%), Immigrants from Japan (15.3%, a difference of 0.060%), Immigrants from Turkey (15.3%, a difference of 0.14%), and Maltese (15.3%, a difference of 0.16%).
| Demographics | Rating | Rank | Single Father Poverty |
| Immigrants | Brazil | 99.6 /100 | #71 | Exceptional 15.3% |
| Immigrants | Lithuania | 99.6 /100 | #72 | Exceptional 15.3% |
| Kenyans | 99.6 /100 | #73 | Exceptional 15.3% |
| Maltese | 99.6 /100 | #74 | Exceptional 15.3% |
| Immigrants | Turkey | 99.5 /100 | #75 | Exceptional 15.3% |
| Immigrants | Japan | 99.5 /100 | #76 | Exceptional 15.3% |
| Immigrants | Peru | 99.5 /100 | #77 | Exceptional 15.3% |
| Tlingit-Haida | 99.5 /100 | #78 | Exceptional 15.3% |
| Immigrants | Northern Africa | 99.5 /100 | #79 | Exceptional 15.3% |
| Armenians | 99.4 /100 | #80 | Exceptional 15.4% |
| Immigrants | Congo | 99.4 /100 | #81 | Exceptional 15.4% |
| Immigrants | Ukraine | 99.4 /100 | #82 | Exceptional 15.4% |
| Chinese | 99.3 /100 | #83 | Exceptional 15.4% |
| Peruvians | 99.2 /100 | #84 | Exceptional 15.4% |
| Immigrants | Oceania | 99.1 /100 | #85 | Exceptional 15.4% |
Demographics Similar to Immigrants from Albania by Single Father Poverty
In terms of single father poverty, the demographic groups most similar to Immigrants from Albania are Albanian (17.2%, a difference of 0.020%), Immigrants from Jamaica (17.2%, a difference of 0.050%), Immigrants from Haiti (17.2%, a difference of 0.080%), Sierra Leonean (17.2%, a difference of 0.090%), and Spaniard (17.2%, a difference of 0.20%).
| Demographics | Rating | Rank | Single Father Poverty |
| Austrians | 1.1 /100 | #250 | Tragic 17.1% |
| Luxembourgers | 1.1 /100 | #251 | Tragic 17.1% |
| Croatians | 1.0 /100 | #252 | Tragic 17.1% |
| Cree | 1.0 /100 | #253 | Tragic 17.1% |
| Immigrants | Honduras | 0.9 /100 | #254 | Tragic 17.1% |
| Sierra Leoneans | 0.8 /100 | #255 | Tragic 17.2% |
| Immigrants | Haiti | 0.8 /100 | #256 | Tragic 17.2% |
| Immigrants | Albania | 0.7 /100 | #257 | Tragic 17.2% |
| Albanians | 0.7 /100 | #258 | Tragic 17.2% |
| Immigrants | Jamaica | 0.7 /100 | #259 | Tragic 17.2% |
| Spaniards | 0.6 /100 | #260 | Tragic 17.2% |
| Swiss | 0.5 /100 | #261 | Tragic 17.3% |
| Immigrants | Zaire | 0.4 /100 | #262 | Tragic 17.3% |
| Lithuanians | 0.4 /100 | #263 | Tragic 17.3% |
| Slovenes | 0.3 /100 | #264 | Tragic 17.3% |