Tlingit-Haida vs Ecuadorian Single Father Poverty
COMPARE
Tlingit-Haida
Ecuadorian
Single Father Poverty
Single Father Poverty Comparison
Tlingit-Haida
Ecuadorians
15.3%
SINGLE FATHER POVERTY
99.5/ 100
METRIC RATING
78th/ 347
METRIC RANK
16.5%
SINGLE FATHER POVERTY
24.5/ 100
METRIC RATING
193rd/ 347
METRIC RANK
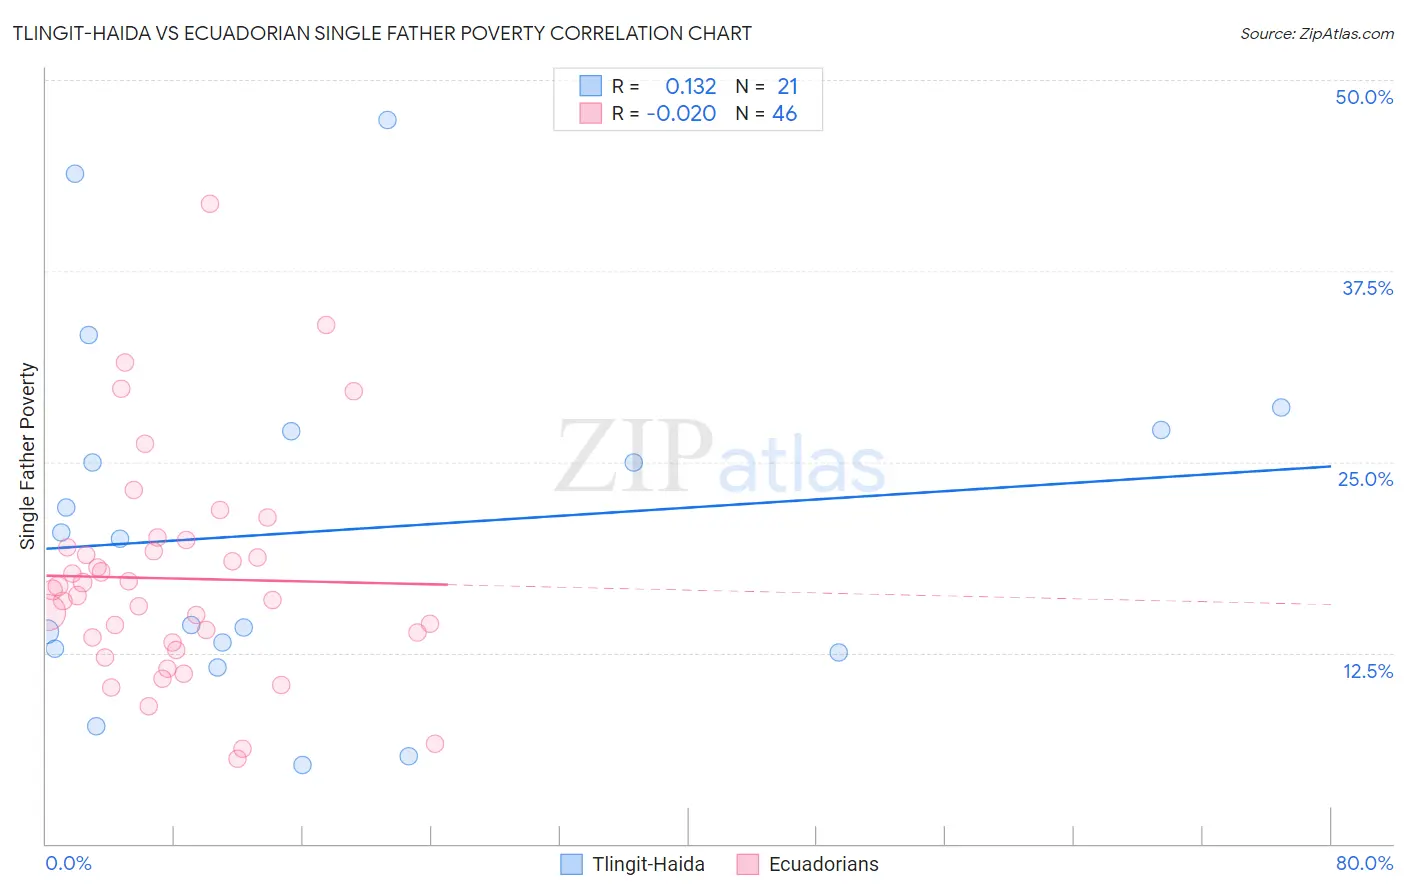
Tlingit-Haida vs Ecuadorian Single Father Poverty Correlation Chart
The statistical analysis conducted on geographies consisting of 55,978,156 people shows a poor positive correlation between the proportion of Tlingit-Haida and poverty level among single fathers in the United States with a correlation coefficient (R) of 0.132 and weighted average of 15.3%. Similarly, the statistical analysis conducted on geographies consisting of 258,169,372 people shows no correlation between the proportion of Ecuadorians and poverty level among single fathers in the United States with a correlation coefficient (R) of -0.020 and weighted average of 16.5%, a difference of 7.5%.
Single Father Poverty Correlation Summary
| Measurement | Tlingit-Haida | Ecuadorian |
| Minimum | 5.1% | 5.6% |
| Maximum | 47.4% | 41.9% |
| Range | 42.2% | 36.3% |
| Mean | 20.5% | 17.4% |
| Median | 20.0% | 16.4% |
| Interquartile 25% (IQ1) | 12.6% | 13.2% |
| Interquartile 75% (IQ3) | 27.1% | 19.4% |
| Interquartile Range (IQR) | 14.4% | 6.2% |
| Standard Deviation (Sample) | 11.5% | 7.2% |
| Standard Deviation (Population) | 11.2% | 7.2% |
Similar Demographics by Single Father Poverty
Demographics Similar to Tlingit-Haida by Single Father Poverty
In terms of single father poverty, the demographic groups most similar to Tlingit-Haida are Immigrants from Northern Africa (15.3%, a difference of 0.020%), Immigrants from Peru (15.3%, a difference of 0.050%), Immigrants from Japan (15.3%, a difference of 0.060%), Immigrants from Turkey (15.3%, a difference of 0.14%), and Maltese (15.3%, a difference of 0.16%).
| Demographics | Rating | Rank | Single Father Poverty |
| Immigrants | Brazil | 99.6 /100 | #71 | Exceptional 15.3% |
| Immigrants | Lithuania | 99.6 /100 | #72 | Exceptional 15.3% |
| Kenyans | 99.6 /100 | #73 | Exceptional 15.3% |
| Maltese | 99.6 /100 | #74 | Exceptional 15.3% |
| Immigrants | Turkey | 99.5 /100 | #75 | Exceptional 15.3% |
| Immigrants | Japan | 99.5 /100 | #76 | Exceptional 15.3% |
| Immigrants | Peru | 99.5 /100 | #77 | Exceptional 15.3% |
| Tlingit-Haida | 99.5 /100 | #78 | Exceptional 15.3% |
| Immigrants | Northern Africa | 99.5 /100 | #79 | Exceptional 15.3% |
| Armenians | 99.4 /100 | #80 | Exceptional 15.4% |
| Immigrants | Congo | 99.4 /100 | #81 | Exceptional 15.4% |
| Immigrants | Ukraine | 99.4 /100 | #82 | Exceptional 15.4% |
| Chinese | 99.3 /100 | #83 | Exceptional 15.4% |
| Peruvians | 99.2 /100 | #84 | Exceptional 15.4% |
| Immigrants | Oceania | 99.1 /100 | #85 | Exceptional 15.4% |
Demographics Similar to Ecuadorians by Single Father Poverty
In terms of single father poverty, the demographic groups most similar to Ecuadorians are Immigrants from Switzerland (16.5%, a difference of 0.010%), Cape Verdean (16.5%, a difference of 0.010%), Immigrants from Barbados (16.5%, a difference of 0.010%), Immigrants from Guyana (16.5%, a difference of 0.15%), and Immigrants from Canada (16.5%, a difference of 0.16%).
| Demographics | Rating | Rank | Single Father Poverty |
| Immigrants | Venezuela | 31.0 /100 | #186 | Fair 16.4% |
| Ukrainians | 30.4 /100 | #187 | Fair 16.4% |
| Russians | 30.1 /100 | #188 | Fair 16.4% |
| Latvians | 28.9 /100 | #189 | Fair 16.5% |
| Immigrants | Burma/Myanmar | 28.0 /100 | #190 | Fair 16.5% |
| Immigrants | Guyana | 27.1 /100 | #191 | Fair 16.5% |
| Immigrants | Switzerland | 24.8 /100 | #192 | Fair 16.5% |
| Ecuadorians | 24.5 /100 | #193 | Fair 16.5% |
| Cape Verdeans | 24.4 /100 | #194 | Fair 16.5% |
| Immigrants | Barbados | 24.3 /100 | #195 | Fair 16.5% |
| Immigrants | Canada | 21.9 /100 | #196 | Fair 16.5% |
| Immigrants | Northern Europe | 20.3 /100 | #197 | Fair 16.5% |
| Romanians | 20.1 /100 | #198 | Fair 16.5% |
| Immigrants | Belize | 19.8 /100 | #199 | Poor 16.5% |
| Syrians | 17.4 /100 | #200 | Poor 16.6% |