Tlingit-Haida vs Slavic Single Father Poverty
COMPARE
Tlingit-Haida
Slavic
Single Father Poverty
Single Father Poverty Comparison
Tlingit-Haida
Slavs
15.3%
SINGLE FATHER POVERTY
99.5/ 100
METRIC RATING
78th/ 347
METRIC RANK
17.4%
SINGLE FATHER POVERTY
0.3/ 100
METRIC RATING
269th/ 347
METRIC RANK
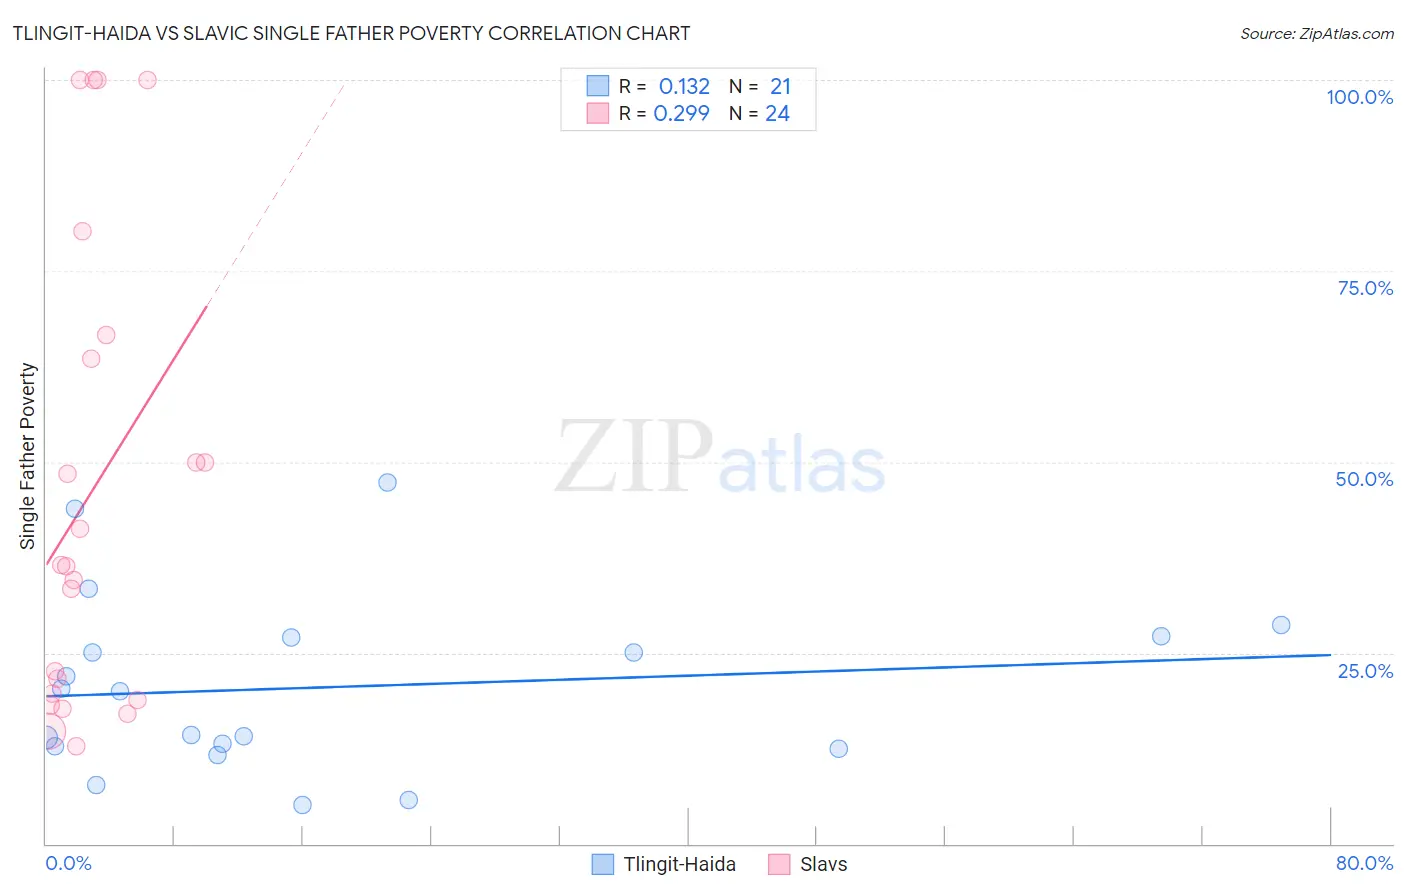
Tlingit-Haida vs Slavic Single Father Poverty Correlation Chart
The statistical analysis conducted on geographies consisting of 55,978,156 people shows a poor positive correlation between the proportion of Tlingit-Haida and poverty level among single fathers in the United States with a correlation coefficient (R) of 0.132 and weighted average of 15.3%. Similarly, the statistical analysis conducted on geographies consisting of 218,860,364 people shows a weak positive correlation between the proportion of Slavs and poverty level among single fathers in the United States with a correlation coefficient (R) of 0.299 and weighted average of 17.4%, a difference of 13.2%.
Single Father Poverty Correlation Summary
| Measurement | Tlingit-Haida | Slavic |
| Minimum | 5.1% | 12.8% |
| Maximum | 47.4% | 100.0% |
| Range | 42.2% | 87.2% |
| Mean | 20.5% | 46.0% |
| Median | 20.0% | 36.4% |
| Interquartile 25% (IQ1) | 12.6% | 19.2% |
| Interquartile 75% (IQ3) | 27.1% | 65.1% |
| Interquartile Range (IQR) | 14.4% | 45.9% |
| Standard Deviation (Sample) | 11.5% | 30.4% |
| Standard Deviation (Population) | 11.2% | 29.7% |
Similar Demographics by Single Father Poverty
Demographics Similar to Tlingit-Haida by Single Father Poverty
In terms of single father poverty, the demographic groups most similar to Tlingit-Haida are Immigrants from Northern Africa (15.3%, a difference of 0.020%), Immigrants from Peru (15.3%, a difference of 0.050%), Immigrants from Japan (15.3%, a difference of 0.060%), Immigrants from Turkey (15.3%, a difference of 0.14%), and Maltese (15.3%, a difference of 0.16%).
| Demographics | Rating | Rank | Single Father Poverty |
| Immigrants | Brazil | 99.6 /100 | #71 | Exceptional 15.3% |
| Immigrants | Lithuania | 99.6 /100 | #72 | Exceptional 15.3% |
| Kenyans | 99.6 /100 | #73 | Exceptional 15.3% |
| Maltese | 99.6 /100 | #74 | Exceptional 15.3% |
| Immigrants | Turkey | 99.5 /100 | #75 | Exceptional 15.3% |
| Immigrants | Japan | 99.5 /100 | #76 | Exceptional 15.3% |
| Immigrants | Peru | 99.5 /100 | #77 | Exceptional 15.3% |
| Tlingit-Haida | 99.5 /100 | #78 | Exceptional 15.3% |
| Immigrants | Northern Africa | 99.5 /100 | #79 | Exceptional 15.3% |
| Armenians | 99.4 /100 | #80 | Exceptional 15.4% |
| Immigrants | Congo | 99.4 /100 | #81 | Exceptional 15.4% |
| Immigrants | Ukraine | 99.4 /100 | #82 | Exceptional 15.4% |
| Chinese | 99.3 /100 | #83 | Exceptional 15.4% |
| Peruvians | 99.2 /100 | #84 | Exceptional 15.4% |
| Immigrants | Oceania | 99.1 /100 | #85 | Exceptional 15.4% |
Demographics Similar to Slavs by Single Father Poverty
In terms of single father poverty, the demographic groups most similar to Slavs are Immigrants from Caribbean (17.4%, a difference of 0.070%), Haitian (17.3%, a difference of 0.17%), Jamaican (17.3%, a difference of 0.21%), Polish (17.3%, a difference of 0.26%), and Indonesian (17.4%, a difference of 0.26%).
| Demographics | Rating | Rank | Single Father Poverty |
| Immigrants | Zaire | 0.4 /100 | #262 | Tragic 17.3% |
| Lithuanians | 0.4 /100 | #263 | Tragic 17.3% |
| Slovenes | 0.3 /100 | #264 | Tragic 17.3% |
| Poles | 0.3 /100 | #265 | Tragic 17.3% |
| Jamaicans | 0.3 /100 | #266 | Tragic 17.3% |
| Haitians | 0.3 /100 | #267 | Tragic 17.3% |
| Immigrants | Caribbean | 0.3 /100 | #268 | Tragic 17.4% |
| Slavs | 0.3 /100 | #269 | Tragic 17.4% |
| Indonesians | 0.2 /100 | #270 | Tragic 17.4% |
| French American Indians | 0.2 /100 | #271 | Tragic 17.4% |
| Barbadians | 0.1 /100 | #272 | Tragic 17.5% |
| Italians | 0.1 /100 | #273 | Tragic 17.5% |
| Macedonians | 0.1 /100 | #274 | Tragic 17.7% |
| British West Indians | 0.0 /100 | #275 | Tragic 17.7% |
| German Russians | 0.0 /100 | #276 | Tragic 17.7% |