Immigrants from Belgium vs Apache Family Poverty
COMPARE
Immigrants from Belgium
Apache
Family Poverty
Family Poverty Comparison
Immigrants from Belgium
Apache
7.8%
FAMILY POVERTY
98.2/ 100
METRIC RATING
69th/ 347
METRIC RANK
14.7%
FAMILY POVERTY
0.0/ 100
METRIC RATING
335th/ 347
METRIC RANK
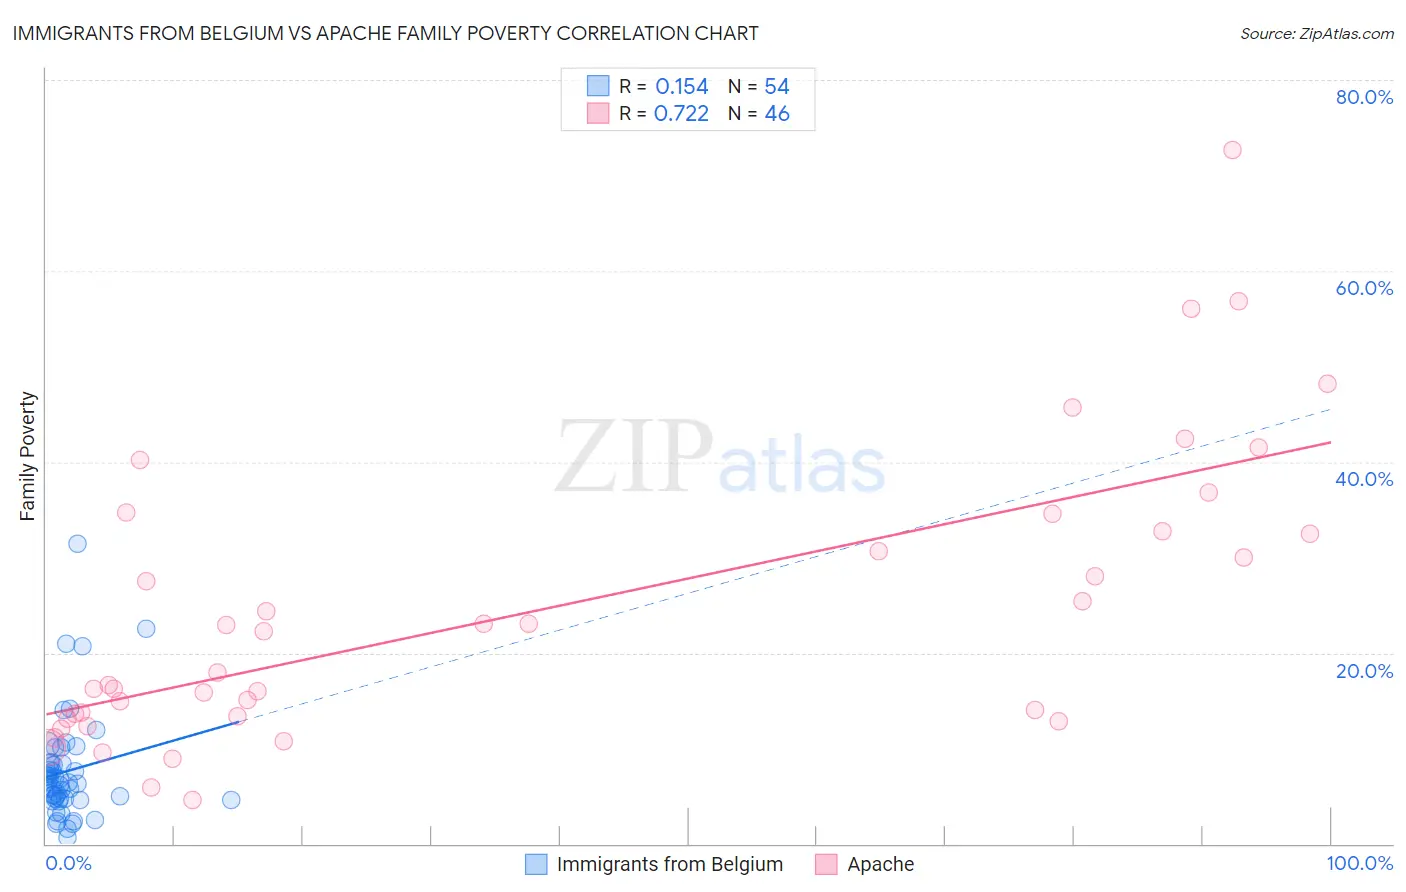
Immigrants from Belgium vs Apache Family Poverty Correlation Chart
The statistical analysis conducted on geographies consisting of 146,524,248 people shows a poor positive correlation between the proportion of Immigrants from Belgium and poverty level among families in the United States with a correlation coefficient (R) of 0.154 and weighted average of 7.8%. Similarly, the statistical analysis conducted on geographies consisting of 230,899,358 people shows a strong positive correlation between the proportion of Apache and poverty level among families in the United States with a correlation coefficient (R) of 0.722 and weighted average of 14.7%, a difference of 88.5%.
Family Poverty Correlation Summary
| Measurement | Immigrants from Belgium | Apache |
| Minimum | 0.69% | 4.6% |
| Maximum | 31.5% | 72.7% |
| Range | 30.8% | 68.1% |
| Mean | 7.6% | 24.5% |
| Median | 6.4% | 20.1% |
| Interquartile 25% (IQ1) | 4.7% | 13.3% |
| Interquartile 75% (IQ3) | 8.4% | 32.7% |
| Interquartile Range (IQR) | 3.7% | 19.4% |
| Standard Deviation (Sample) | 5.6% | 15.1% |
| Standard Deviation (Population) | 5.6% | 14.9% |
Similar Demographics by Family Poverty
Demographics Similar to Immigrants from Belgium by Family Poverty
In terms of family poverty, the demographic groups most similar to Immigrants from Belgium are Australian (7.8%, a difference of 0.010%), Immigrants from Canada (7.8%, a difference of 0.040%), Northern European (7.8%, a difference of 0.050%), Dutch (7.8%, a difference of 0.060%), and Cambodian (7.8%, a difference of 0.060%).
| Demographics | Rating | Rank | Family Poverty |
| Macedonians | 98.6 /100 | #62 | Exceptional 7.8% |
| Zimbabweans | 98.4 /100 | #63 | Exceptional 7.8% |
| Koreans | 98.3 /100 | #64 | Exceptional 7.8% |
| Immigrants | Bulgaria | 98.3 /100 | #65 | Exceptional 7.8% |
| Dutch | 98.3 /100 | #66 | Exceptional 7.8% |
| Northern Europeans | 98.3 /100 | #67 | Exceptional 7.8% |
| Australians | 98.2 /100 | #68 | Exceptional 7.8% |
| Immigrants | Belgium | 98.2 /100 | #69 | Exceptional 7.8% |
| Immigrants | Canada | 98.2 /100 | #70 | Exceptional 7.8% |
| Cambodians | 98.2 /100 | #71 | Exceptional 7.8% |
| Immigrants | Romania | 98.2 /100 | #72 | Exceptional 7.8% |
| Austrians | 98.2 /100 | #73 | Exceptional 7.8% |
| Immigrants | China | 98.1 /100 | #74 | Exceptional 7.8% |
| Immigrants | Croatia | 98.1 /100 | #75 | Exceptional 7.8% |
| Immigrants | Latvia | 98.0 /100 | #76 | Exceptional 7.9% |
Demographics Similar to Apache by Family Poverty
In terms of family poverty, the demographic groups most similar to Apache are Houma (14.6%, a difference of 0.85%), Immigrants from Dominican Republic (14.4%, a difference of 2.1%), Dominican (14.3%, a difference of 2.8%), Cheyenne (14.3%, a difference of 3.2%), and Native/Alaskan (14.3%, a difference of 3.4%).
| Demographics | Rating | Rank | Family Poverty |
| Central American Indians | 0.0 /100 | #328 | Tragic 13.3% |
| Blacks/African Americans | 0.0 /100 | #329 | Tragic 13.3% |
| Natives/Alaskans | 0.0 /100 | #330 | Tragic 14.3% |
| Cheyenne | 0.0 /100 | #331 | Tragic 14.3% |
| Dominicans | 0.0 /100 | #332 | Tragic 14.3% |
| Immigrants | Dominican Republic | 0.0 /100 | #333 | Tragic 14.4% |
| Houma | 0.0 /100 | #334 | Tragic 14.6% |
| Apache | 0.0 /100 | #335 | Tragic 14.7% |
| Sioux | 0.0 /100 | #336 | Tragic 15.9% |
| Hopi | 0.0 /100 | #337 | Tragic 15.9% |
| Crow | 0.0 /100 | #338 | Tragic 16.1% |
| Yuman | 0.0 /100 | #339 | Tragic 16.6% |
| Pueblo | 0.0 /100 | #340 | Tragic 17.0% |
| Lumbee | 0.0 /100 | #341 | Tragic 17.0% |
| Immigrants | Yemen | 0.0 /100 | #342 | Tragic 17.5% |