Tlingit-Haida vs Apache Male Poverty
COMPARE
Tlingit-Haida
Apache
Male Poverty
Male Poverty Comparison
Tlingit-Haida
Apache
10.9%
MALE POVERTY
76.1/ 100
METRIC RATING
140th/ 347
METRIC RANK
17.7%
MALE POVERTY
0.0/ 100
METRIC RATING
335th/ 347
METRIC RANK
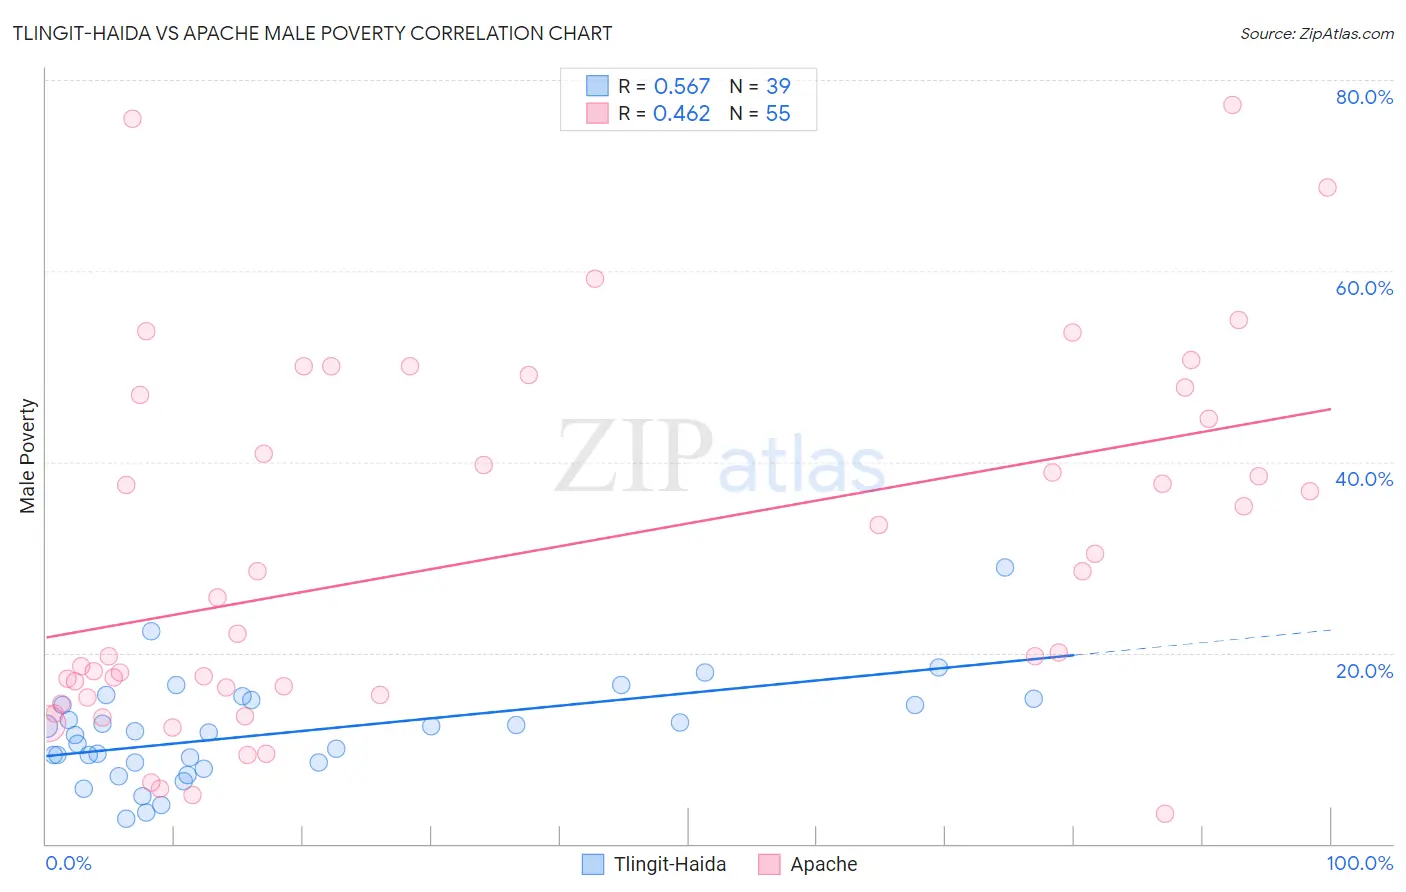
Tlingit-Haida vs Apache Male Poverty Correlation Chart
The statistical analysis conducted on geographies consisting of 60,854,564 people shows a substantial positive correlation between the proportion of Tlingit-Haida and poverty level among males in the United States with a correlation coefficient (R) of 0.567 and weighted average of 10.9%. Similarly, the statistical analysis conducted on geographies consisting of 231,014,108 people shows a moderate positive correlation between the proportion of Apache and poverty level among males in the United States with a correlation coefficient (R) of 0.462 and weighted average of 17.7%, a difference of 62.5%.
Male Poverty Correlation Summary
| Measurement | Tlingit-Haida | Apache |
| Minimum | 2.6% | 3.1% |
| Maximum | 28.9% | 77.3% |
| Range | 26.3% | 74.2% |
| Mean | 11.7% | 30.4% |
| Median | 11.6% | 25.8% |
| Interquartile 25% (IQ1) | 8.5% | 15.6% |
| Interquartile 75% (IQ3) | 15.1% | 47.0% |
| Interquartile Range (IQR) | 6.6% | 31.5% |
| Standard Deviation (Sample) | 5.2% | 18.8% |
| Standard Deviation (Population) | 5.2% | 18.6% |
Similar Demographics by Male Poverty
Demographics Similar to Tlingit-Haida by Male Poverty
In terms of male poverty, the demographic groups most similar to Tlingit-Haida are Immigrants from France (10.9%, a difference of 0.030%), Immigrants from Jordan (10.8%, a difference of 0.19%), Basque (10.9%, a difference of 0.20%), Yugoslavian (10.8%, a difference of 0.31%), and Immigrants from Switzerland (10.8%, a difference of 0.46%).
| Demographics | Rating | Rank | Male Poverty |
| Pakistanis | 83.0 /100 | #133 | Excellent 10.8% |
| New Zealanders | 82.9 /100 | #134 | Excellent 10.8% |
| Brazilians | 82.7 /100 | #135 | Excellent 10.8% |
| Immigrants | Israel | 80.9 /100 | #136 | Excellent 10.8% |
| Immigrants | Switzerland | 79.2 /100 | #137 | Good 10.8% |
| Yugoslavians | 78.2 /100 | #138 | Good 10.8% |
| Immigrants | Jordan | 77.5 /100 | #139 | Good 10.8% |
| Tlingit-Haida | 76.1 /100 | #140 | Good 10.9% |
| Immigrants | France | 75.8 /100 | #141 | Good 10.9% |
| Basques | 74.6 /100 | #142 | Good 10.9% |
| Afghans | 71.9 /100 | #143 | Good 10.9% |
| Samoans | 71.8 /100 | #144 | Good 10.9% |
| Immigrants | Germany | 71.6 /100 | #145 | Good 10.9% |
| Syrians | 71.4 /100 | #146 | Good 10.9% |
| Icelanders | 68.5 /100 | #147 | Good 11.0% |
Demographics Similar to Apache by Male Poverty
In terms of male poverty, the demographic groups most similar to Apache are Cheyenne (17.6%, a difference of 0.20%), Native/Alaskan (16.9%, a difference of 4.4%), Pueblo (18.5%, a difference of 4.8%), Houma (16.7%, a difference of 5.7%), and Sioux (18.7%, a difference of 5.9%).
| Demographics | Rating | Rank | Male Poverty |
| Blacks/African Americans | 0.0 /100 | #328 | Tragic 15.8% |
| Dominicans | 0.0 /100 | #329 | Tragic 16.1% |
| Immigrants | Dominican Republic | 0.0 /100 | #330 | Tragic 16.2% |
| Ute | 0.0 /100 | #331 | Tragic 16.2% |
| Houma | 0.0 /100 | #332 | Tragic 16.7% |
| Natives/Alaskans | 0.0 /100 | #333 | Tragic 16.9% |
| Cheyenne | 0.0 /100 | #334 | Tragic 17.6% |
| Apache | 0.0 /100 | #335 | Tragic 17.7% |
| Pueblo | 0.0 /100 | #336 | Tragic 18.5% |
| Sioux | 0.0 /100 | #337 | Tragic 18.7% |
| Crow | 0.0 /100 | #338 | Tragic 19.1% |
| Yuman | 0.0 /100 | #339 | Tragic 19.5% |
| Immigrants | Yemen | 0.0 /100 | #340 | Tragic 20.1% |
| Lumbee | 0.0 /100 | #341 | Tragic 20.2% |
| Pima | 0.0 /100 | #342 | Tragic 20.4% |