Nicaraguan vs Apache Family Poverty
COMPARE
Nicaraguan
Apache
Family Poverty
Family Poverty Comparison
Nicaraguans
Apache
10.6%
FAMILY POVERTY
0.4/ 100
METRIC RATING
248th/ 347
METRIC RANK
14.7%
FAMILY POVERTY
0.0/ 100
METRIC RATING
335th/ 347
METRIC RANK
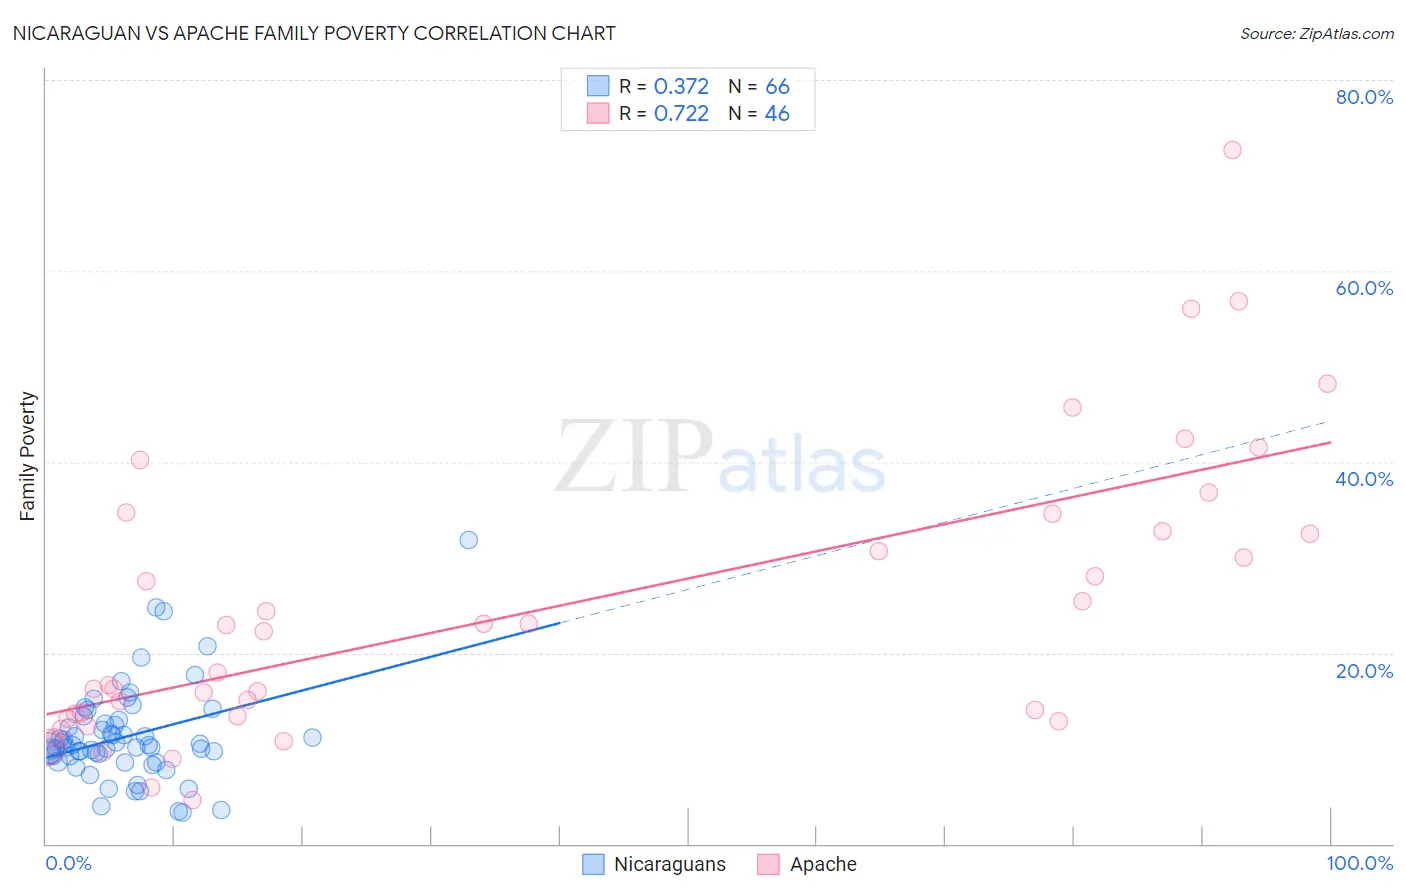
Nicaraguan vs Apache Family Poverty Correlation Chart
The statistical analysis conducted on geographies consisting of 285,444,498 people shows a mild positive correlation between the proportion of Nicaraguans and poverty level among families in the United States with a correlation coefficient (R) of 0.372 and weighted average of 10.6%. Similarly, the statistical analysis conducted on geographies consisting of 230,899,358 people shows a strong positive correlation between the proportion of Apache and poverty level among families in the United States with a correlation coefficient (R) of 0.722 and weighted average of 14.7%, a difference of 38.7%.
Family Poverty Correlation Summary
| Measurement | Nicaraguan | Apache |
| Minimum | 3.3% | 4.6% |
| Maximum | 31.8% | 72.7% |
| Range | 28.5% | 68.1% |
| Mean | 11.2% | 24.5% |
| Median | 10.2% | 20.1% |
| Interquartile 25% (IQ1) | 9.2% | 13.3% |
| Interquartile 75% (IQ3) | 12.6% | 32.7% |
| Interquartile Range (IQR) | 3.4% | 19.4% |
| Standard Deviation (Sample) | 5.0% | 15.1% |
| Standard Deviation (Population) | 4.9% | 14.9% |
Similar Demographics by Family Poverty
Demographics Similar to Nicaraguans by Family Poverty
In terms of family poverty, the demographic groups most similar to Nicaraguans are Cuban (10.6%, a difference of 0.050%), Liberian (10.6%, a difference of 0.20%), Cherokee (10.6%, a difference of 0.29%), Salvadoran (10.7%, a difference of 0.57%), and Iroquois (10.7%, a difference of 0.86%).
| Demographics | Rating | Rank | Family Poverty |
| Ghanaians | 1.3 /100 | #241 | Tragic 10.3% |
| Alaska Natives | 1.0 /100 | #242 | Tragic 10.4% |
| Nepalese | 0.8 /100 | #243 | Tragic 10.4% |
| Cree | 0.7 /100 | #244 | Tragic 10.5% |
| Immigrants | Burma/Myanmar | 0.6 /100 | #245 | Tragic 10.5% |
| Cherokee | 0.5 /100 | #246 | Tragic 10.6% |
| Liberians | 0.4 /100 | #247 | Tragic 10.6% |
| Nicaraguans | 0.4 /100 | #248 | Tragic 10.6% |
| Cubans | 0.4 /100 | #249 | Tragic 10.6% |
| Salvadorans | 0.3 /100 | #250 | Tragic 10.7% |
| Iroquois | 0.3 /100 | #251 | Tragic 10.7% |
| Immigrants | Zaire | 0.3 /100 | #252 | Tragic 10.7% |
| Immigrants | Western Africa | 0.3 /100 | #253 | Tragic 10.7% |
| Ecuadorians | 0.2 /100 | #254 | Tragic 10.8% |
| Immigrants | Liberia | 0.2 /100 | #255 | Tragic 10.8% |
Demographics Similar to Apache by Family Poverty
In terms of family poverty, the demographic groups most similar to Apache are Houma (14.6%, a difference of 0.85%), Immigrants from Dominican Republic (14.4%, a difference of 2.1%), Dominican (14.3%, a difference of 2.8%), Cheyenne (14.3%, a difference of 3.2%), and Native/Alaskan (14.3%, a difference of 3.4%).
| Demographics | Rating | Rank | Family Poverty |
| Central American Indians | 0.0 /100 | #328 | Tragic 13.3% |
| Blacks/African Americans | 0.0 /100 | #329 | Tragic 13.3% |
| Natives/Alaskans | 0.0 /100 | #330 | Tragic 14.3% |
| Cheyenne | 0.0 /100 | #331 | Tragic 14.3% |
| Dominicans | 0.0 /100 | #332 | Tragic 14.3% |
| Immigrants | Dominican Republic | 0.0 /100 | #333 | Tragic 14.4% |
| Houma | 0.0 /100 | #334 | Tragic 14.6% |
| Apache | 0.0 /100 | #335 | Tragic 14.7% |
| Sioux | 0.0 /100 | #336 | Tragic 15.9% |
| Hopi | 0.0 /100 | #337 | Tragic 15.9% |
| Crow | 0.0 /100 | #338 | Tragic 16.1% |
| Yuman | 0.0 /100 | #339 | Tragic 16.6% |
| Pueblo | 0.0 /100 | #340 | Tragic 17.0% |
| Lumbee | 0.0 /100 | #341 | Tragic 17.0% |
| Immigrants | Yemen | 0.0 /100 | #342 | Tragic 17.5% |