Moroccan vs Apache Family Poverty
COMPARE
Moroccan
Apache
Family Poverty
Family Poverty Comparison
Moroccans
Apache
9.8%
FAMILY POVERTY
6.5/ 100
METRIC RATING
216th/ 347
METRIC RANK
14.7%
FAMILY POVERTY
0.0/ 100
METRIC RATING
335th/ 347
METRIC RANK
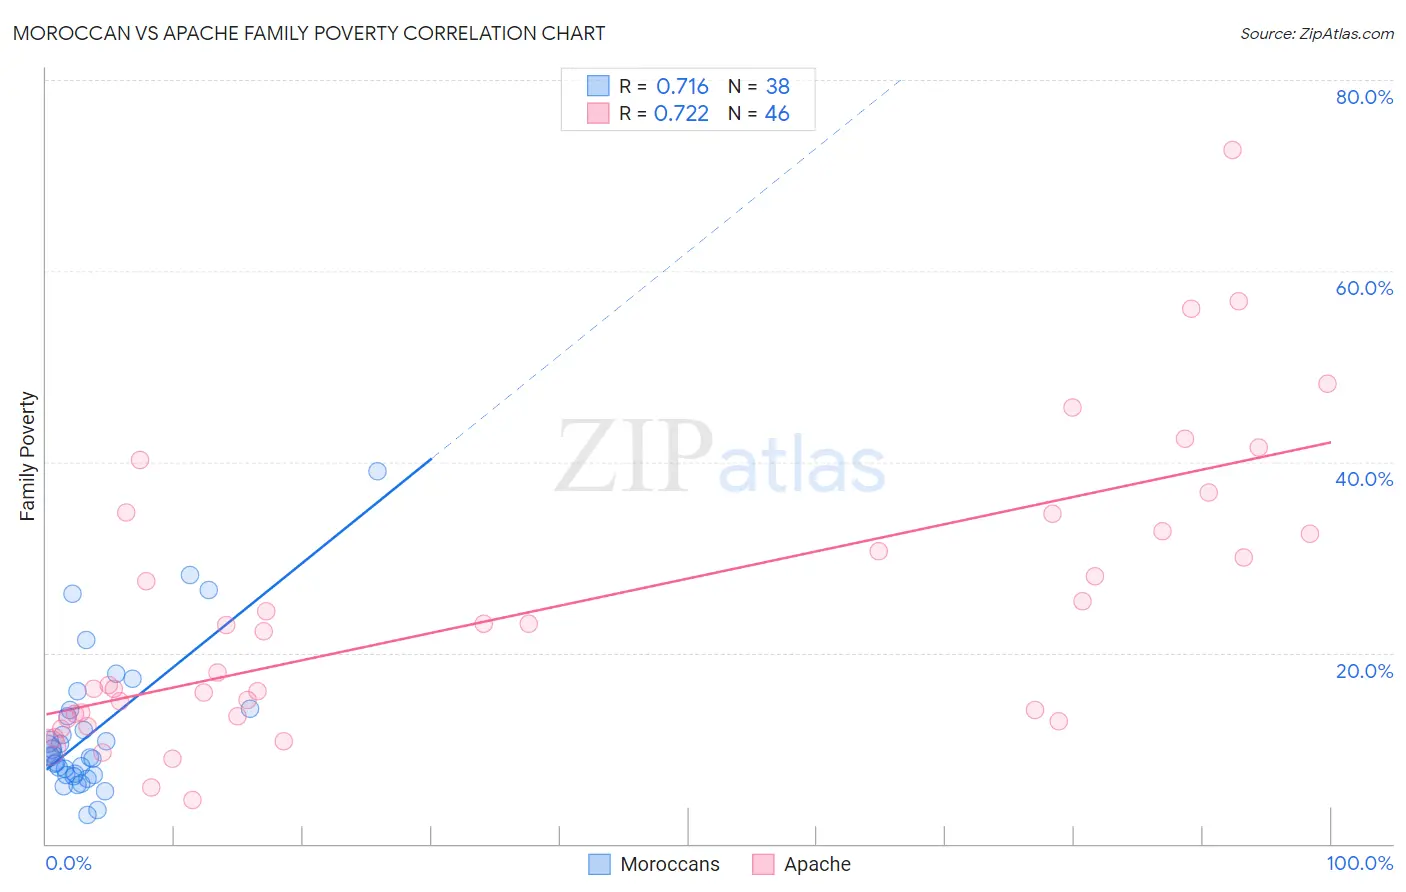
Moroccan vs Apache Family Poverty Correlation Chart
The statistical analysis conducted on geographies consisting of 201,527,529 people shows a strong positive correlation between the proportion of Moroccans and poverty level among families in the United States with a correlation coefficient (R) of 0.716 and weighted average of 9.8%. Similarly, the statistical analysis conducted on geographies consisting of 230,899,358 people shows a strong positive correlation between the proportion of Apache and poverty level among families in the United States with a correlation coefficient (R) of 0.722 and weighted average of 14.7%, a difference of 50.6%.
Family Poverty Correlation Summary
| Measurement | Moroccan | Apache |
| Minimum | 3.0% | 4.6% |
| Maximum | 39.0% | 72.7% |
| Range | 36.0% | 68.1% |
| Mean | 11.9% | 24.5% |
| Median | 9.2% | 20.1% |
| Interquartile 25% (IQ1) | 7.2% | 13.3% |
| Interquartile 75% (IQ3) | 14.0% | 32.7% |
| Interquartile Range (IQR) | 6.7% | 19.4% |
| Standard Deviation (Sample) | 7.6% | 15.1% |
| Standard Deviation (Population) | 7.5% | 14.9% |
Similar Demographics by Family Poverty
Demographics Similar to Moroccans by Family Poverty
In terms of family poverty, the demographic groups most similar to Moroccans are Nonimmigrants (9.8%, a difference of 0.060%), Immigrants from Micronesia (9.8%, a difference of 0.090%), American (9.8%, a difference of 0.20%), Panamanian (9.8%, a difference of 0.52%), and Immigrants from Eritrea (9.9%, a difference of 0.64%).
| Demographics | Rating | Rank | Family Poverty |
| Immigrants | Uruguay | 14.0 /100 | #209 | Poor 9.5% |
| Alsatians | 11.3 /100 | #210 | Poor 9.6% |
| Malaysians | 10.6 /100 | #211 | Poor 9.6% |
| Immigrants | Thailand | 9.7 /100 | #212 | Tragic 9.7% |
| Osage | 8.0 /100 | #213 | Tragic 9.7% |
| Immigrants | Micronesia | 6.7 /100 | #214 | Tragic 9.8% |
| Immigrants | Nonimmigrants | 6.7 /100 | #215 | Tragic 9.8% |
| Moroccans | 6.5 /100 | #216 | Tragic 9.8% |
| Americans | 6.2 /100 | #217 | Tragic 9.8% |
| Panamanians | 5.6 /100 | #218 | Tragic 9.8% |
| Immigrants | Eritrea | 5.4 /100 | #219 | Tragic 9.9% |
| Bermudans | 5.3 /100 | #220 | Tragic 9.9% |
| Immigrants | Cambodia | 4.8 /100 | #221 | Tragic 9.9% |
| Japanese | 4.8 /100 | #222 | Tragic 9.9% |
| Immigrants | Africa | 4.3 /100 | #223 | Tragic 9.9% |
Demographics Similar to Apache by Family Poverty
In terms of family poverty, the demographic groups most similar to Apache are Houma (14.6%, a difference of 0.85%), Immigrants from Dominican Republic (14.4%, a difference of 2.1%), Dominican (14.3%, a difference of 2.8%), Cheyenne (14.3%, a difference of 3.2%), and Native/Alaskan (14.3%, a difference of 3.4%).
| Demographics | Rating | Rank | Family Poverty |
| Central American Indians | 0.0 /100 | #328 | Tragic 13.3% |
| Blacks/African Americans | 0.0 /100 | #329 | Tragic 13.3% |
| Natives/Alaskans | 0.0 /100 | #330 | Tragic 14.3% |
| Cheyenne | 0.0 /100 | #331 | Tragic 14.3% |
| Dominicans | 0.0 /100 | #332 | Tragic 14.3% |
| Immigrants | Dominican Republic | 0.0 /100 | #333 | Tragic 14.4% |
| Houma | 0.0 /100 | #334 | Tragic 14.6% |
| Apache | 0.0 /100 | #335 | Tragic 14.7% |
| Sioux | 0.0 /100 | #336 | Tragic 15.9% |
| Hopi | 0.0 /100 | #337 | Tragic 15.9% |
| Crow | 0.0 /100 | #338 | Tragic 16.1% |
| Yuman | 0.0 /100 | #339 | Tragic 16.6% |
| Pueblo | 0.0 /100 | #340 | Tragic 17.0% |
| Lumbee | 0.0 /100 | #341 | Tragic 17.0% |
| Immigrants | Yemen | 0.0 /100 | #342 | Tragic 17.5% |