Tlingit-Haida vs Apache Disability Age 18 to 34
COMPARE
Tlingit-Haida
Apache
Disability Age 18 to 34
Disability Age 18 to 34 Comparison
Tlingit-Haida
Apache
7.7%
DISABILITY AGE 18 TO 34
0.0/ 100
METRIC RATING
295th/ 347
METRIC RANK
8.4%
DISABILITY AGE 18 TO 34
0.0/ 100
METRIC RATING
333rd/ 347
METRIC RANK
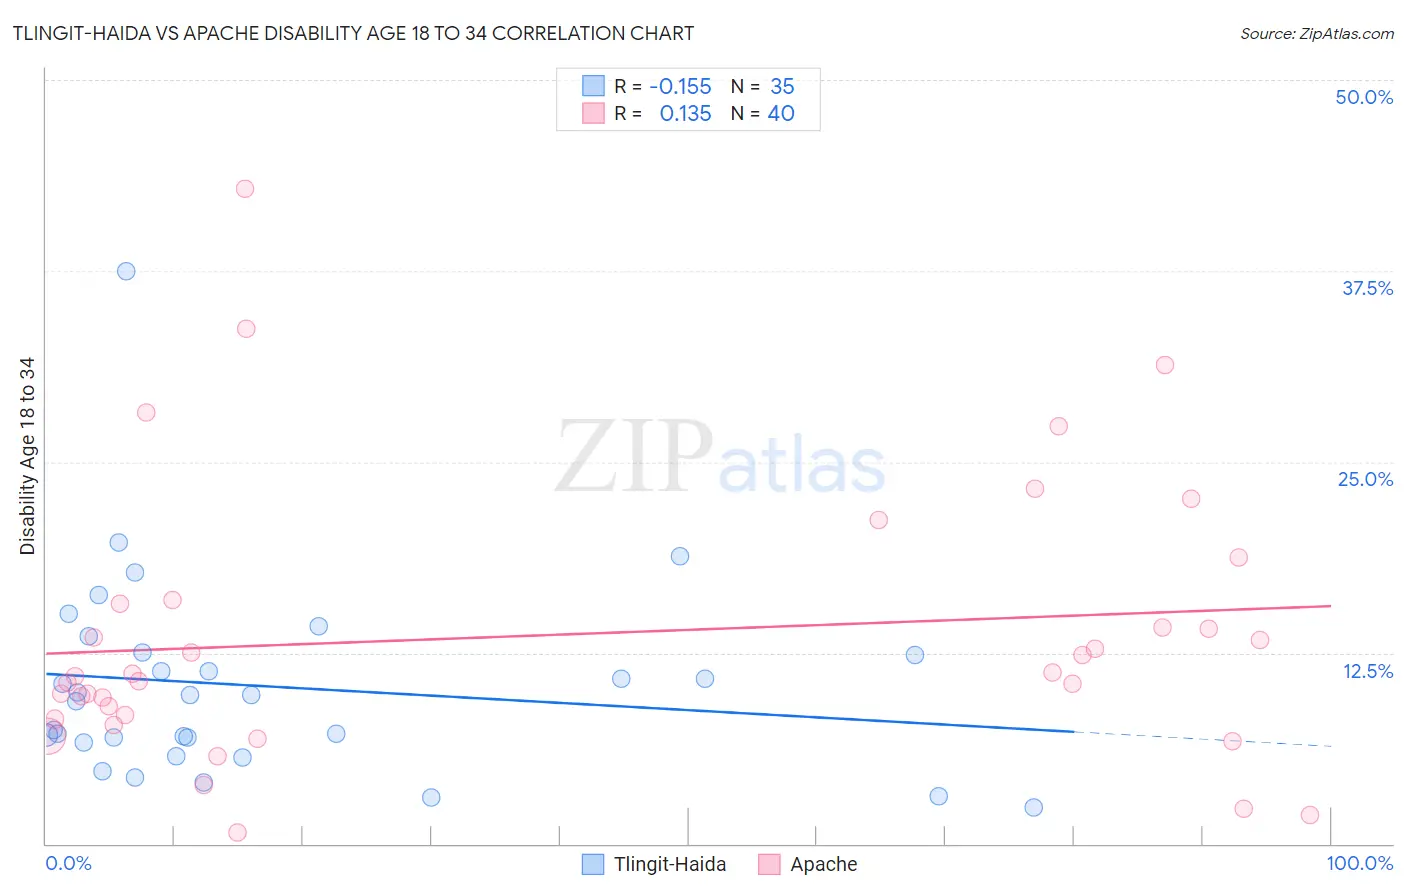
Tlingit-Haida vs Apache Disability Age 18 to 34 Correlation Chart
The statistical analysis conducted on geographies consisting of 60,778,142 people shows a poor negative correlation between the proportion of Tlingit-Haida and percentage of population with a disability between the ages 18 and 35 in the United States with a correlation coefficient (R) of -0.155 and weighted average of 7.7%. Similarly, the statistical analysis conducted on geographies consisting of 230,768,782 people shows a poor positive correlation between the proportion of Apache and percentage of population with a disability between the ages 18 and 35 in the United States with a correlation coefficient (R) of 0.135 and weighted average of 8.4%, a difference of 9.4%.
Disability Age 18 to 34 Correlation Summary
| Measurement | Tlingit-Haida | Apache |
| Minimum | 2.4% | 0.77% |
| Maximum | 37.5% | 42.9% |
| Range | 35.1% | 42.1% |
| Mean | 10.3% | 13.6% |
| Median | 9.7% | 11.0% |
| Interquartile 25% (IQ1) | 6.6% | 8.3% |
| Interquartile 75% (IQ3) | 12.5% | 15.8% |
| Interquartile Range (IQR) | 5.9% | 7.6% |
| Standard Deviation (Sample) | 6.5% | 9.0% |
| Standard Deviation (Population) | 6.4% | 8.9% |
Similar Demographics by Disability Age 18 to 34
Demographics Similar to Tlingit-Haida by Disability Age 18 to 34
In terms of disability age 18 to 34, the demographic groups most similar to Tlingit-Haida are Immigrants from Cabo Verde (7.7%, a difference of 0.010%), Scandinavian (7.7%, a difference of 0.16%), Cape Verdean (7.7%, a difference of 0.18%), Pueblo (7.7%, a difference of 0.19%), and Black/African American (7.7%, a difference of 0.22%).
| Demographics | Rating | Rank | Disability Age 18 to 34 |
| Whites/Caucasians | 0.0 /100 | #288 | Tragic 7.6% |
| Immigrants | Nonimmigrants | 0.0 /100 | #289 | Tragic 7.6% |
| Slovaks | 0.0 /100 | #290 | Tragic 7.7% |
| Irish | 0.0 /100 | #291 | Tragic 7.7% |
| Blacks/African Americans | 0.0 /100 | #292 | Tragic 7.7% |
| Scandinavians | 0.0 /100 | #293 | Tragic 7.7% |
| Immigrants | Cabo Verde | 0.0 /100 | #294 | Tragic 7.7% |
| Tlingit-Haida | 0.0 /100 | #295 | Tragic 7.7% |
| Cape Verdeans | 0.0 /100 | #296 | Tragic 7.7% |
| Pueblo | 0.0 /100 | #297 | Tragic 7.7% |
| Dutch | 0.0 /100 | #298 | Tragic 7.7% |
| Germans | 0.0 /100 | #299 | Tragic 7.7% |
| Scottish | 0.0 /100 | #300 | Tragic 7.7% |
| Pima | 0.0 /100 | #301 | Tragic 7.7% |
| Welsh | 0.0 /100 | #302 | Tragic 7.7% |
Demographics Similar to Apache by Disability Age 18 to 34
In terms of disability age 18 to 34, the demographic groups most similar to Apache are Dutch West Indian (8.4%, a difference of 0.21%), Seminole (8.4%, a difference of 0.33%), Puget Sound Salish (8.3%, a difference of 1.1%), Comanche (8.3%, a difference of 1.3%), and Osage (8.3%, a difference of 1.5%).
| Demographics | Rating | Rank | Disability Age 18 to 34 |
| Potawatomi | 0.0 /100 | #326 | Tragic 8.2% |
| Sioux | 0.0 /100 | #327 | Tragic 8.2% |
| Delaware | 0.0 /100 | #328 | Tragic 8.2% |
| Crow | 0.0 /100 | #329 | Tragic 8.3% |
| Osage | 0.0 /100 | #330 | Tragic 8.3% |
| Comanche | 0.0 /100 | #331 | Tragic 8.3% |
| Puget Sound Salish | 0.0 /100 | #332 | Tragic 8.3% |
| Apache | 0.0 /100 | #333 | Tragic 8.4% |
| Dutch West Indians | 0.0 /100 | #334 | Tragic 8.4% |
| Seminole | 0.0 /100 | #335 | Tragic 8.4% |
| Immigrants | Azores | 0.0 /100 | #336 | Tragic 8.5% |
| Ottawa | 0.0 /100 | #337 | Tragic 8.6% |
| Cherokee | 0.0 /100 | #338 | Tragic 8.7% |
| Kiowa | 0.0 /100 | #339 | Tragic 8.8% |
| Choctaw | 0.0 /100 | #340 | Tragic 9.0% |