Greek vs Apache Family Poverty
COMPARE
Greek
Apache
Family Poverty
Family Poverty Comparison
Greeks
Apache
7.5%
FAMILY POVERTY
99.4/ 100
METRIC RATING
35th/ 347
METRIC RANK
14.7%
FAMILY POVERTY
0.0/ 100
METRIC RATING
335th/ 347
METRIC RANK
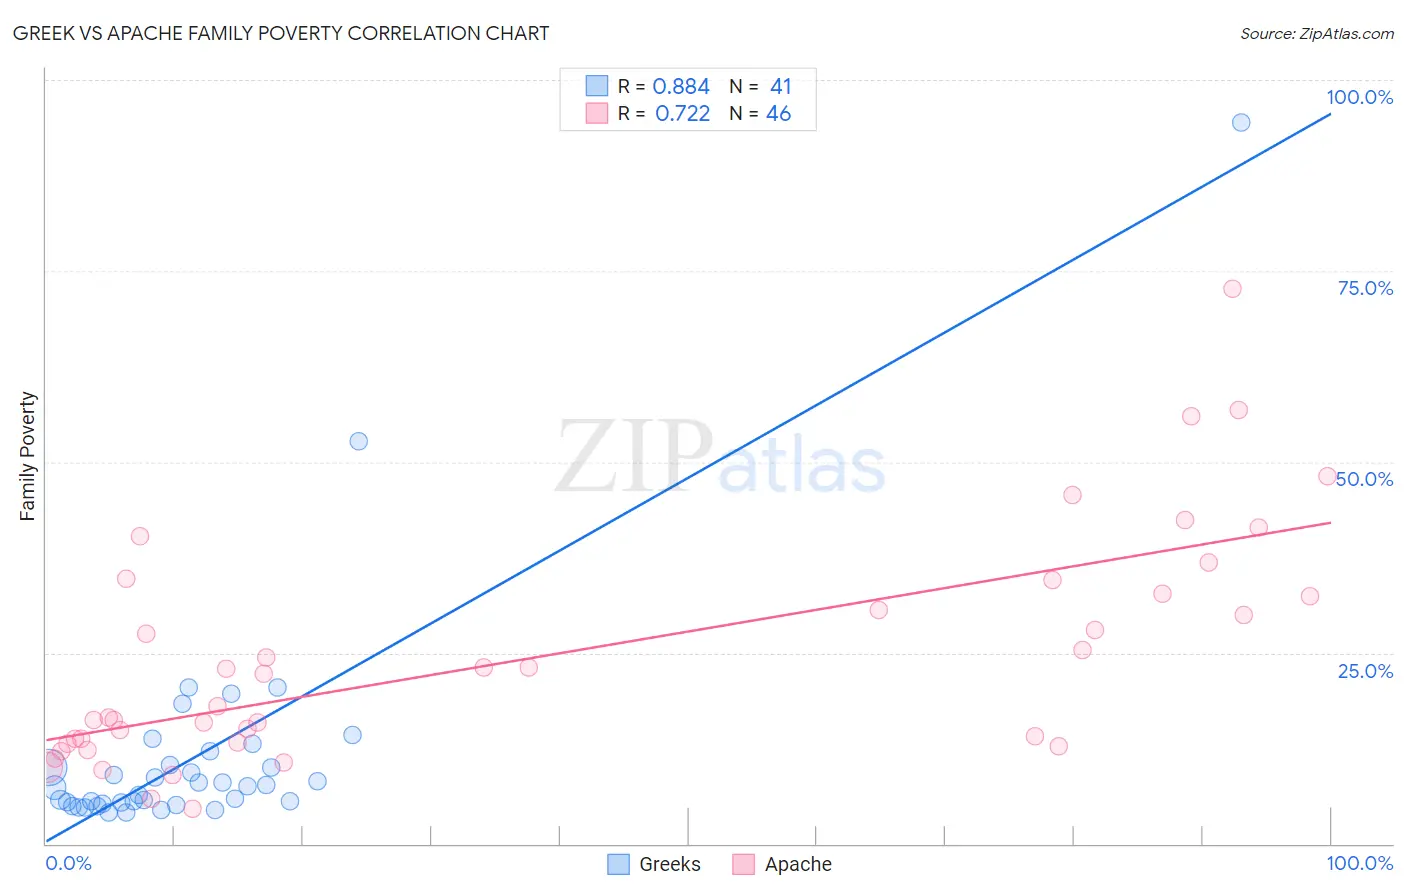
Greek vs Apache Family Poverty Correlation Chart
The statistical analysis conducted on geographies consisting of 480,426,664 people shows a very strong positive correlation between the proportion of Greeks and poverty level among families in the United States with a correlation coefficient (R) of 0.884 and weighted average of 7.5%. Similarly, the statistical analysis conducted on geographies consisting of 230,899,358 people shows a strong positive correlation between the proportion of Apache and poverty level among families in the United States with a correlation coefficient (R) of 0.722 and weighted average of 14.7%, a difference of 96.4%.
Family Poverty Correlation Summary
| Measurement | Greek | Apache |
| Minimum | 4.1% | 4.6% |
| Maximum | 94.4% | 72.7% |
| Range | 90.3% | 68.1% |
| Mean | 11.7% | 24.5% |
| Median | 7.5% | 20.1% |
| Interquartile 25% (IQ1) | 5.3% | 13.3% |
| Interquartile 75% (IQ3) | 11.2% | 32.7% |
| Interquartile Range (IQR) | 5.9% | 19.4% |
| Standard Deviation (Sample) | 15.6% | 15.1% |
| Standard Deviation (Population) | 15.4% | 14.9% |
Similar Demographics by Family Poverty
Demographics Similar to Greeks by Family Poverty
In terms of family poverty, the demographic groups most similar to Greeks are Turkish (7.5%, a difference of 0.010%), Estonian (7.5%, a difference of 0.18%), Bolivian (7.5%, a difference of 0.43%), Carpatho Rusyn (7.5%, a difference of 0.49%), and Slovene (7.5%, a difference of 0.52%).
| Demographics | Rating | Rank | Family Poverty |
| Immigrants | Korea | 99.6 /100 | #28 | Exceptional 7.4% |
| Immigrants | Northern Europe | 99.6 /100 | #29 | Exceptional 7.4% |
| Italians | 99.6 /100 | #30 | Exceptional 7.4% |
| Czechs | 99.6 /100 | #31 | Exceptional 7.4% |
| Poles | 99.5 /100 | #32 | Exceptional 7.4% |
| Immigrants | Japan | 99.5 /100 | #33 | Exceptional 7.4% |
| Russians | 99.5 /100 | #34 | Exceptional 7.5% |
| Greeks | 99.4 /100 | #35 | Exceptional 7.5% |
| Turks | 99.4 /100 | #36 | Exceptional 7.5% |
| Estonians | 99.4 /100 | #37 | Exceptional 7.5% |
| Bolivians | 99.3 /100 | #38 | Exceptional 7.5% |
| Carpatho Rusyns | 99.3 /100 | #39 | Exceptional 7.5% |
| Slovenes | 99.3 /100 | #40 | Exceptional 7.5% |
| Immigrants | Australia | 99.2 /100 | #41 | Exceptional 7.6% |
| Scandinavians | 99.1 /100 | #42 | Exceptional 7.6% |
Demographics Similar to Apache by Family Poverty
In terms of family poverty, the demographic groups most similar to Apache are Houma (14.6%, a difference of 0.85%), Immigrants from Dominican Republic (14.4%, a difference of 2.1%), Dominican (14.3%, a difference of 2.8%), Cheyenne (14.3%, a difference of 3.2%), and Native/Alaskan (14.3%, a difference of 3.4%).
| Demographics | Rating | Rank | Family Poverty |
| Central American Indians | 0.0 /100 | #328 | Tragic 13.3% |
| Blacks/African Americans | 0.0 /100 | #329 | Tragic 13.3% |
| Natives/Alaskans | 0.0 /100 | #330 | Tragic 14.3% |
| Cheyenne | 0.0 /100 | #331 | Tragic 14.3% |
| Dominicans | 0.0 /100 | #332 | Tragic 14.3% |
| Immigrants | Dominican Republic | 0.0 /100 | #333 | Tragic 14.4% |
| Houma | 0.0 /100 | #334 | Tragic 14.6% |
| Apache | 0.0 /100 | #335 | Tragic 14.7% |
| Sioux | 0.0 /100 | #336 | Tragic 15.9% |
| Hopi | 0.0 /100 | #337 | Tragic 15.9% |
| Crow | 0.0 /100 | #338 | Tragic 16.1% |
| Yuman | 0.0 /100 | #339 | Tragic 16.6% |
| Pueblo | 0.0 /100 | #340 | Tragic 17.0% |
| Lumbee | 0.0 /100 | #341 | Tragic 17.0% |
| Immigrants | Yemen | 0.0 /100 | #342 | Tragic 17.5% |