Spanish American vs Apache Family Poverty
COMPARE
Spanish American
Apache
Family Poverty
Family Poverty Comparison
Spanish Americans
Apache
11.2%
FAMILY POVERTY
0.1/ 100
METRIC RATING
274th/ 347
METRIC RANK
14.7%
FAMILY POVERTY
0.0/ 100
METRIC RATING
335th/ 347
METRIC RANK
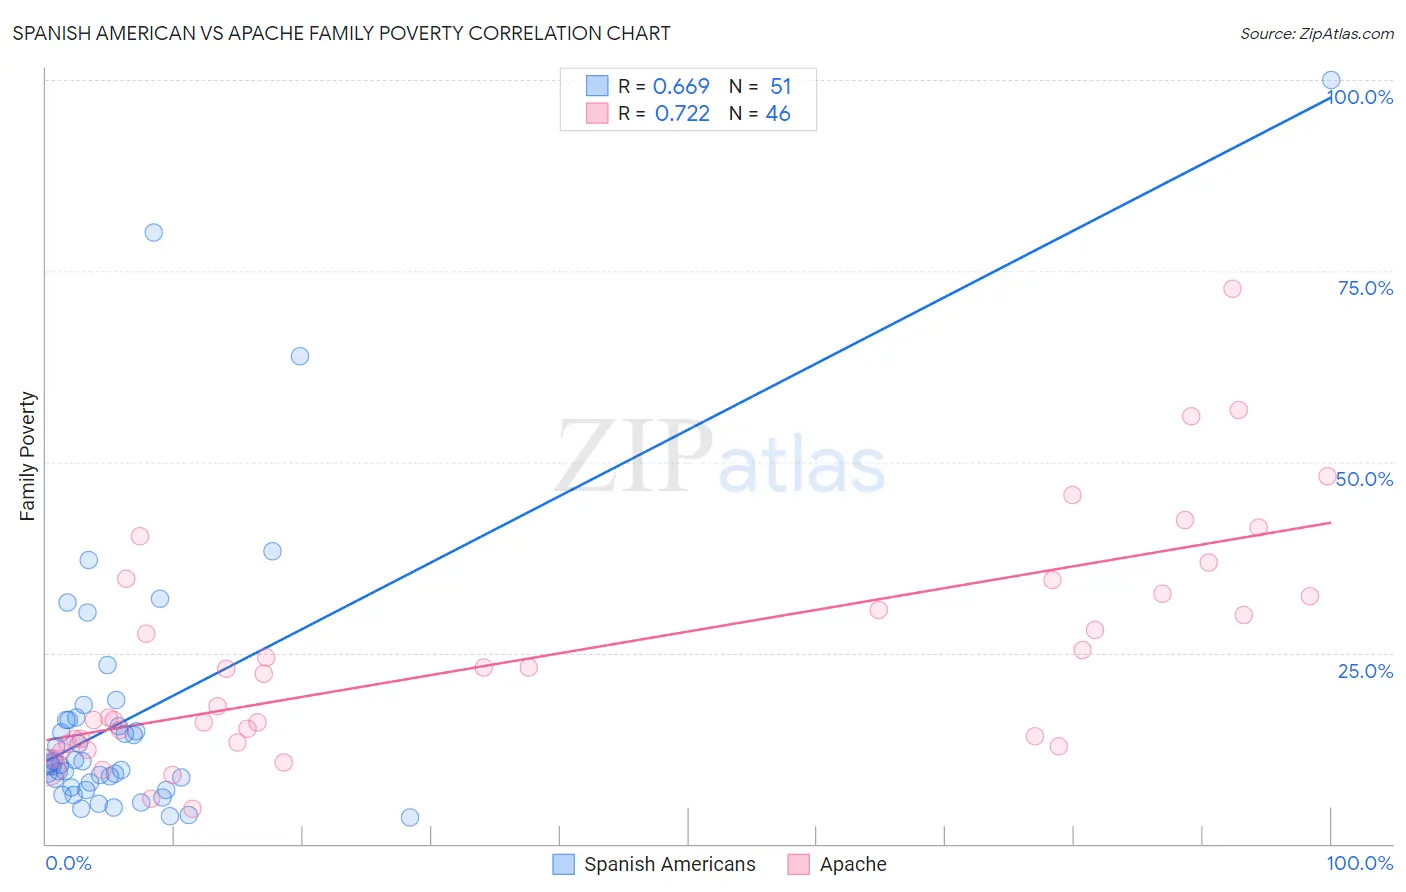
Spanish American vs Apache Family Poverty Correlation Chart
The statistical analysis conducted on geographies consisting of 103,138,189 people shows a significant positive correlation between the proportion of Spanish Americans and poverty level among families in the United States with a correlation coefficient (R) of 0.669 and weighted average of 11.2%. Similarly, the statistical analysis conducted on geographies consisting of 230,899,358 people shows a strong positive correlation between the proportion of Apache and poverty level among families in the United States with a correlation coefficient (R) of 0.722 and weighted average of 14.7%, a difference of 31.4%.
Family Poverty Correlation Summary
| Measurement | Spanish American | Apache |
| Minimum | 3.4% | 4.6% |
| Maximum | 100.0% | 72.7% |
| Range | 96.6% | 68.1% |
| Mean | 16.8% | 24.5% |
| Median | 10.5% | 20.1% |
| Interquartile 25% (IQ1) | 7.4% | 13.3% |
| Interquartile 75% (IQ3) | 16.2% | 32.7% |
| Interquartile Range (IQR) | 8.8% | 19.4% |
| Standard Deviation (Sample) | 18.6% | 15.1% |
| Standard Deviation (Population) | 18.4% | 14.9% |
Similar Demographics by Family Poverty
Demographics Similar to Spanish Americans by Family Poverty
In terms of family poverty, the demographic groups most similar to Spanish Americans are Central American (11.2%, a difference of 0.050%), Immigrants from Guyana (11.2%, a difference of 0.070%), Somali (11.2%, a difference of 0.090%), Chippewa (11.2%, a difference of 0.16%), and Guyanese (11.2%, a difference of 0.19%).
| Demographics | Rating | Rank | Family Poverty |
| Comanche | 0.1 /100 | #267 | Tragic 11.0% |
| Jamaicans | 0.1 /100 | #268 | Tragic 11.1% |
| Immigrants | Ecuador | 0.1 /100 | #269 | Tragic 11.1% |
| Immigrants | Nicaragua | 0.1 /100 | #270 | Tragic 11.1% |
| Immigrants | Bahamas | 0.1 /100 | #271 | Tragic 11.1% |
| Immigrants | Jamaica | 0.1 /100 | #272 | Tragic 11.2% |
| Somalis | 0.1 /100 | #273 | Tragic 11.2% |
| Spanish Americans | 0.1 /100 | #274 | Tragic 11.2% |
| Central Americans | 0.1 /100 | #275 | Tragic 11.2% |
| Immigrants | Guyana | 0.1 /100 | #276 | Tragic 11.2% |
| Chippewa | 0.1 /100 | #277 | Tragic 11.2% |
| Guyanese | 0.1 /100 | #278 | Tragic 11.2% |
| Blackfeet | 0.0 /100 | #279 | Tragic 11.3% |
| Belizeans | 0.0 /100 | #280 | Tragic 11.3% |
| Immigrants | West Indies | 0.0 /100 | #281 | Tragic 11.3% |
Demographics Similar to Apache by Family Poverty
In terms of family poverty, the demographic groups most similar to Apache are Houma (14.6%, a difference of 0.85%), Immigrants from Dominican Republic (14.4%, a difference of 2.1%), Dominican (14.3%, a difference of 2.8%), Cheyenne (14.3%, a difference of 3.2%), and Native/Alaskan (14.3%, a difference of 3.4%).
| Demographics | Rating | Rank | Family Poverty |
| Central American Indians | 0.0 /100 | #328 | Tragic 13.3% |
| Blacks/African Americans | 0.0 /100 | #329 | Tragic 13.3% |
| Natives/Alaskans | 0.0 /100 | #330 | Tragic 14.3% |
| Cheyenne | 0.0 /100 | #331 | Tragic 14.3% |
| Dominicans | 0.0 /100 | #332 | Tragic 14.3% |
| Immigrants | Dominican Republic | 0.0 /100 | #333 | Tragic 14.4% |
| Houma | 0.0 /100 | #334 | Tragic 14.6% |
| Apache | 0.0 /100 | #335 | Tragic 14.7% |
| Sioux | 0.0 /100 | #336 | Tragic 15.9% |
| Hopi | 0.0 /100 | #337 | Tragic 15.9% |
| Crow | 0.0 /100 | #338 | Tragic 16.1% |
| Yuman | 0.0 /100 | #339 | Tragic 16.6% |
| Pueblo | 0.0 /100 | #340 | Tragic 17.0% |
| Lumbee | 0.0 /100 | #341 | Tragic 17.0% |
| Immigrants | Yemen | 0.0 /100 | #342 | Tragic 17.5% |