Somali vs Lumbee Unemployment Among Women with Children Under 6 years
COMPARE
Somali
Lumbee
Unemployment Among Women with Children Under 6 years
Unemployment Among Women with Children Under 6 years Comparison
Somalis
Lumbee
6.9%
UNEMPLOYMENT AMONG WOMEN WITH CHILDREN UNDER 6 YEARS
99.7/ 100
METRIC RATING
62nd/ 347
METRIC RANK
13.8%
UNEMPLOYMENT AMONG WOMEN WITH CHILDREN UNDER 6 YEARS
0.0/ 100
METRIC RATING
341st/ 347
METRIC RANK
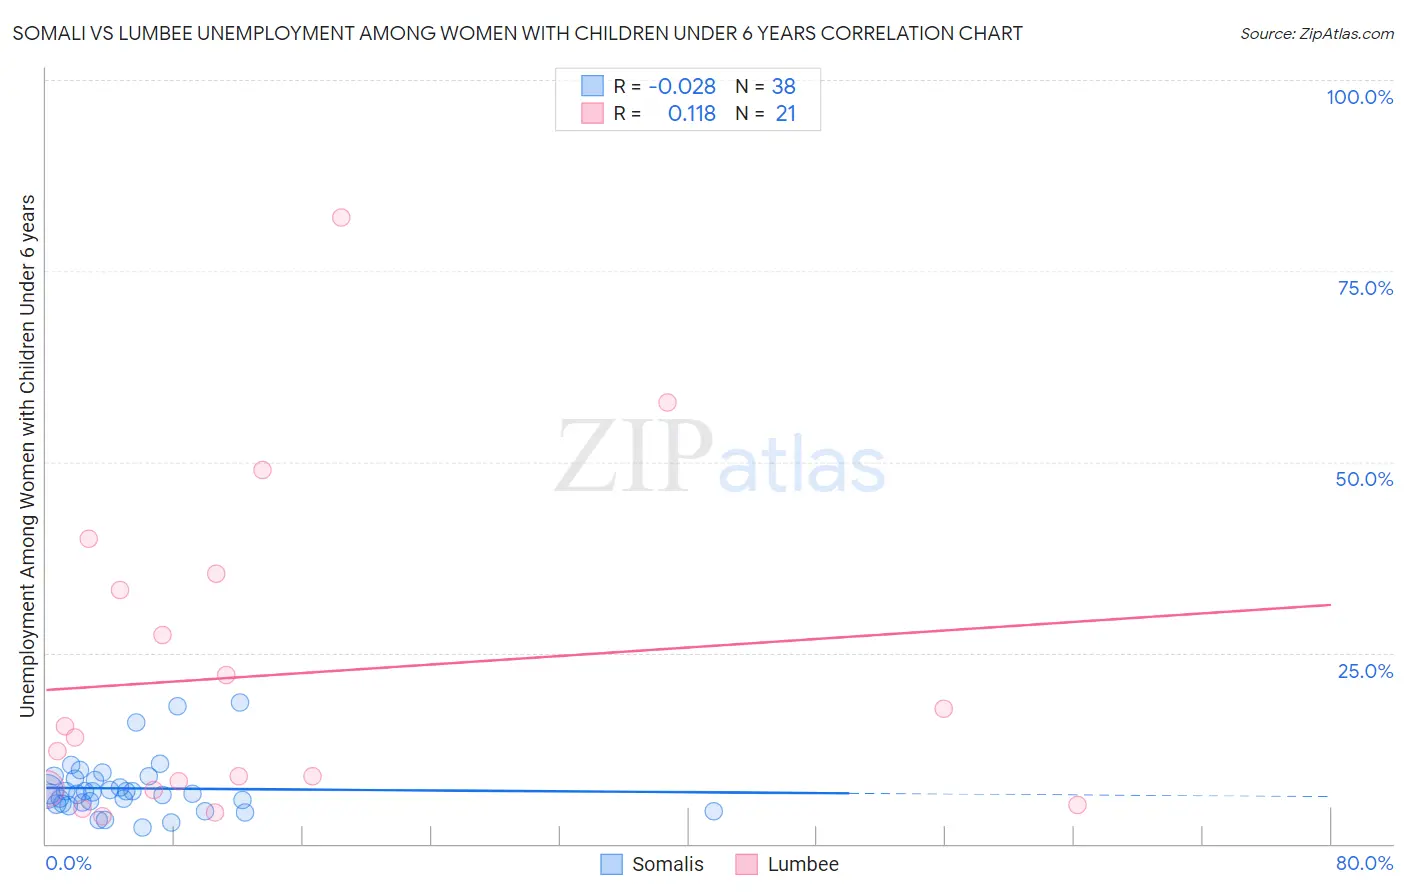
Somali vs Lumbee Unemployment Among Women with Children Under 6 years Correlation Chart
The statistical analysis conducted on geographies consisting of 89,780,147 people shows no correlation between the proportion of Somalis and unemployment rate among women with children under the age of 6 in the United States with a correlation coefficient (R) of -0.028 and weighted average of 6.9%. Similarly, the statistical analysis conducted on geographies consisting of 81,574,095 people shows a poor positive correlation between the proportion of Lumbee and unemployment rate among women with children under the age of 6 in the United States with a correlation coefficient (R) of 0.118 and weighted average of 13.8%, a difference of 99.7%.
Unemployment Among Women with Children Under 6 years Correlation Summary
| Measurement | Somali | Lumbee |
| Minimum | 2.1% | 3.6% |
| Maximum | 18.5% | 82.0% |
| Range | 16.4% | 78.4% |
| Mean | 7.2% | 22.1% |
| Median | 6.7% | 14.0% |
| Interquartile 25% (IQ1) | 5.2% | 7.2% |
| Interquartile 75% (IQ3) | 8.5% | 34.3% |
| Interquartile Range (IQR) | 3.3% | 27.1% |
| Standard Deviation (Sample) | 3.6% | 20.9% |
| Standard Deviation (Population) | 3.6% | 20.4% |
Similar Demographics by Unemployment Among Women with Children Under 6 years
Demographics Similar to Somalis by Unemployment Among Women with Children Under 6 years
In terms of unemployment among women with children under 6 years, the demographic groups most similar to Somalis are Immigrants from France (6.9%, a difference of 0.040%), Maltese (6.9%, a difference of 0.050%), Tongan (6.9%, a difference of 0.15%), Immigrants from Kuwait (6.9%, a difference of 0.29%), and Immigrants from Sri Lanka (6.9%, a difference of 0.41%).
| Demographics | Rating | Rank | Unemployment Among Women with Children Under 6 years |
| Immigrants | Ukraine | 99.8 /100 | #55 | Exceptional 6.8% |
| Immigrants | Ethiopia | 99.8 /100 | #56 | Exceptional 6.9% |
| Icelanders | 99.8 /100 | #57 | Exceptional 6.9% |
| Immigrants | Turkey | 99.8 /100 | #58 | Exceptional 6.9% |
| Immigrants | Serbia | 99.8 /100 | #59 | Exceptional 6.9% |
| Immigrants | Sri Lanka | 99.8 /100 | #60 | Exceptional 6.9% |
| Immigrants | France | 99.7 /100 | #61 | Exceptional 6.9% |
| Somalis | 99.7 /100 | #62 | Exceptional 6.9% |
| Maltese | 99.7 /100 | #63 | Exceptional 6.9% |
| Tongans | 99.7 /100 | #64 | Exceptional 6.9% |
| Immigrants | Kuwait | 99.7 /100 | #65 | Exceptional 6.9% |
| Immigrants | Belgium | 99.6 /100 | #66 | Exceptional 6.9% |
| Immigrants | Netherlands | 99.5 /100 | #67 | Exceptional 7.0% |
| Paraguayans | 99.4 /100 | #68 | Exceptional 7.0% |
| Immigrants | Eritrea | 99.4 /100 | #69 | Exceptional 7.0% |
Demographics Similar to Lumbee by Unemployment Among Women with Children Under 6 years
In terms of unemployment among women with children under 6 years, the demographic groups most similar to Lumbee are Navajo (13.5%, a difference of 2.2%), Immigrants from Yemen (13.5%, a difference of 2.2%), Pima (13.4%, a difference of 2.6%), Chippewa (13.3%, a difference of 3.4%), and Shoshone (13.2%, a difference of 4.6%).
| Demographics | Rating | Rank | Unemployment Among Women with Children Under 6 years |
| Natives/Alaskans | 0.0 /100 | #333 | Tragic 11.5% |
| Apache | 0.0 /100 | #334 | Tragic 12.3% |
| Puerto Ricans | 0.0 /100 | #335 | Tragic 12.5% |
| Shoshone | 0.0 /100 | #336 | Tragic 13.2% |
| Chippewa | 0.0 /100 | #337 | Tragic 13.3% |
| Pima | 0.0 /100 | #338 | Tragic 13.4% |
| Navajo | 0.0 /100 | #339 | Tragic 13.5% |
| Immigrants | Yemen | 0.0 /100 | #340 | Tragic 13.5% |
| Lumbee | 0.0 /100 | #341 | Tragic 13.8% |
| Yuman | 0.0 /100 | #342 | Tragic 14.6% |
| Crow | 0.0 /100 | #343 | Tragic 14.6% |
| Hopi | 0.0 /100 | #344 | Tragic 16.8% |
| Inupiat | 0.0 /100 | #345 | Tragic 17.7% |
| Arapaho | 0.0 /100 | #346 | Tragic 19.0% |
| Yup'ik | 0.0 /100 | #347 | Tragic 21.1% |