Somali vs Aleut Female Poverty
COMPARE
Somali
Aleut
Female Poverty
Female Poverty Comparison
Somalis
Aleuts
16.6%
FEMALE POVERTY
0.0/ 100
METRIC RATING
298th/ 347
METRIC RANK
13.4%
FEMALE POVERTY
56.7/ 100
METRIC RATING
168th/ 347
METRIC RANK
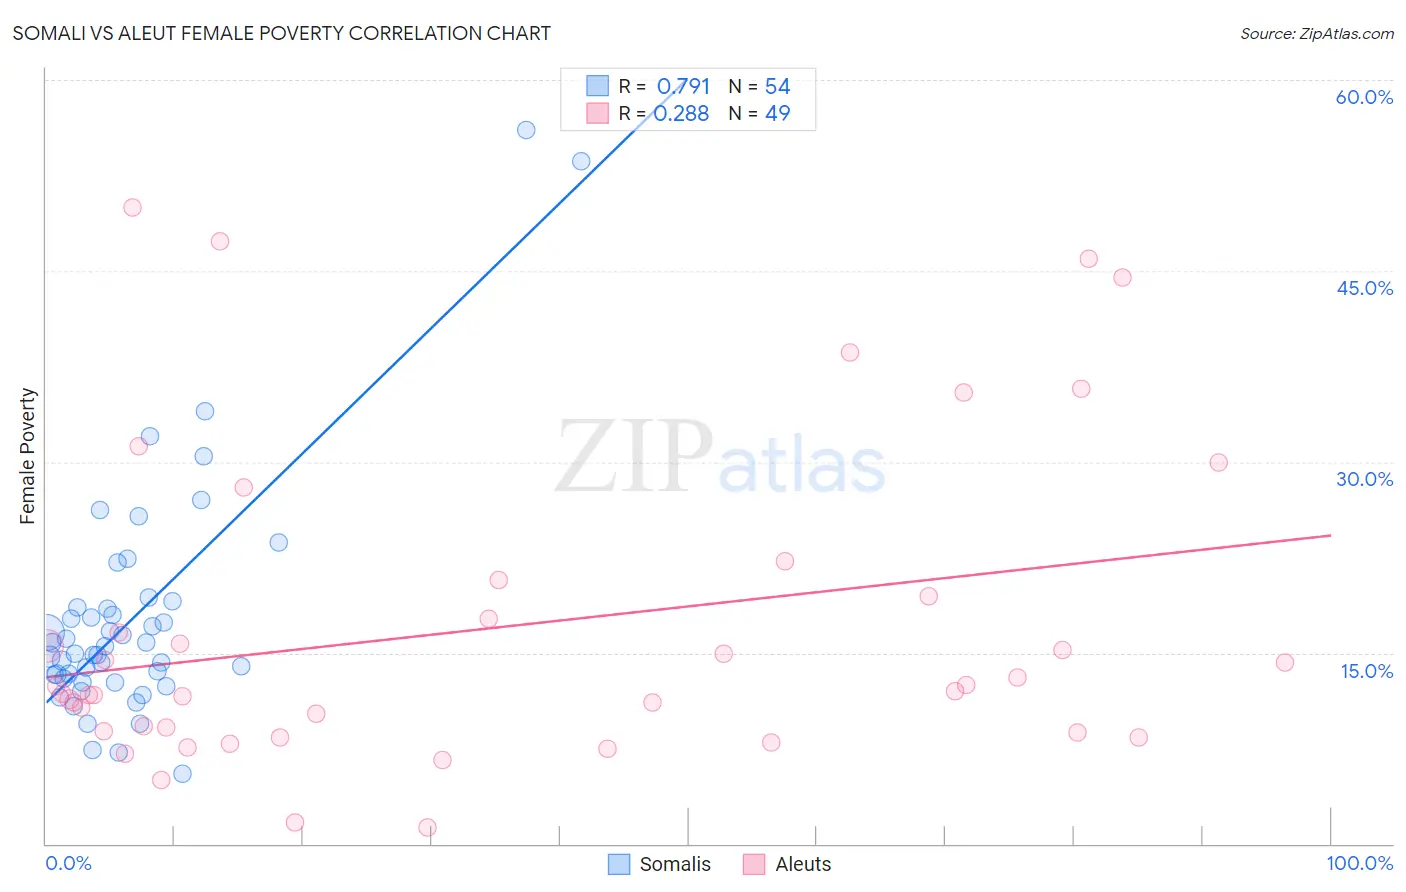
Somali vs Aleut Female Poverty Correlation Chart
The statistical analysis conducted on geographies consisting of 99,282,230 people shows a strong positive correlation between the proportion of Somalis and poverty level among females in the United States with a correlation coefficient (R) of 0.791 and weighted average of 16.6%. Similarly, the statistical analysis conducted on geographies consisting of 61,771,544 people shows a weak positive correlation between the proportion of Aleuts and poverty level among females in the United States with a correlation coefficient (R) of 0.288 and weighted average of 13.4%, a difference of 24.0%.
Female Poverty Correlation Summary
| Measurement | Somali | Aleut |
| Minimum | 5.5% | 1.3% |
| Maximum | 56.1% | 50.0% |
| Range | 50.6% | 48.7% |
| Mean | 17.8% | 16.9% |
| Median | 15.2% | 12.0% |
| Interquartile 25% (IQ1) | 13.0% | 8.8% |
| Interquartile 75% (IQ3) | 18.6% | 20.1% |
| Interquartile Range (IQR) | 5.6% | 11.3% |
| Standard Deviation (Sample) | 9.4% | 12.3% |
| Standard Deviation (Population) | 9.3% | 12.2% |
Similar Demographics by Female Poverty
Demographics Similar to Somalis by Female Poverty
In terms of female poverty, the demographic groups most similar to Somalis are Mexican (16.5%, a difference of 0.20%), Hispanic or Latino (16.6%, a difference of 0.52%), Bahamian (16.6%, a difference of 0.56%), Immigrants from Senegal (16.5%, a difference of 0.60%), and Senegalese (16.5%, a difference of 0.62%).
| Demographics | Rating | Rank | Female Poverty |
| Yaqui | 0.0 /100 | #291 | Tragic 16.4% |
| Immigrants | Zaire | 0.0 /100 | #292 | Tragic 16.4% |
| Immigrants | Latin America | 0.0 /100 | #293 | Tragic 16.4% |
| Immigrants | Cabo Verde | 0.0 /100 | #294 | Tragic 16.4% |
| Senegalese | 0.0 /100 | #295 | Tragic 16.5% |
| Immigrants | Senegal | 0.0 /100 | #296 | Tragic 16.5% |
| Mexicans | 0.0 /100 | #297 | Tragic 16.5% |
| Somalis | 0.0 /100 | #298 | Tragic 16.6% |
| Hispanics or Latinos | 0.0 /100 | #299 | Tragic 16.6% |
| Bahamians | 0.0 /100 | #300 | Tragic 16.6% |
| Guatemalans | 0.0 /100 | #301 | Tragic 16.7% |
| Chippewa | 0.0 /100 | #302 | Tragic 16.7% |
| Choctaw | 0.0 /100 | #303 | Tragic 16.8% |
| Immigrants | Central America | 0.0 /100 | #304 | Tragic 16.8% |
| Immigrants | Grenada | 0.0 /100 | #305 | Tragic 16.8% |
Demographics Similar to Aleuts by Female Poverty
In terms of female poverty, the demographic groups most similar to Aleuts are Immigrants from Chile (13.3%, a difference of 0.060%), Lebanese (13.4%, a difference of 0.080%), Colombian (13.4%, a difference of 0.10%), White/Caucasian (13.4%, a difference of 0.21%), and Immigrants from Oceania (13.3%, a difference of 0.30%).
| Demographics | Rating | Rank | Female Poverty |
| Immigrants | Ethiopia | 62.5 /100 | #161 | Good 13.3% |
| Guamanians/Chamorros | 62.4 /100 | #162 | Good 13.3% |
| Immigrants | Albania | 62.4 /100 | #163 | Good 13.3% |
| Ethiopians | 62.3 /100 | #164 | Good 13.3% |
| Scotch-Irish | 62.1 /100 | #165 | Good 13.3% |
| Immigrants | Oceania | 59.7 /100 | #166 | Average 13.3% |
| Immigrants | Chile | 57.4 /100 | #167 | Average 13.3% |
| Aleuts | 56.7 /100 | #168 | Average 13.4% |
| Lebanese | 55.9 /100 | #169 | Average 13.4% |
| Colombians | 55.7 /100 | #170 | Average 13.4% |
| Whites/Caucasians | 54.6 /100 | #171 | Average 13.4% |
| Mongolians | 53.6 /100 | #172 | Average 13.4% |
| Immigrants | Afghanistan | 50.8 /100 | #173 | Average 13.4% |
| Immigrants | Iraq | 50.0 /100 | #174 | Average 13.4% |
| Celtics | 49.9 /100 | #175 | Average 13.4% |