Somali vs Lumbee Receiving Food Stamps
COMPARE
Somali
Lumbee
Receiving Food Stamps
Receiving Food Stamps Comparison
Somalis
Lumbee
13.7%
RECEIVING FOOD STAMPS
0.9/ 100
METRIC RATING
243rd/ 347
METRIC RANK
22.9%
RECEIVING FOOD STAMPS
0.0/ 100
METRIC RATING
344th/ 347
METRIC RANK
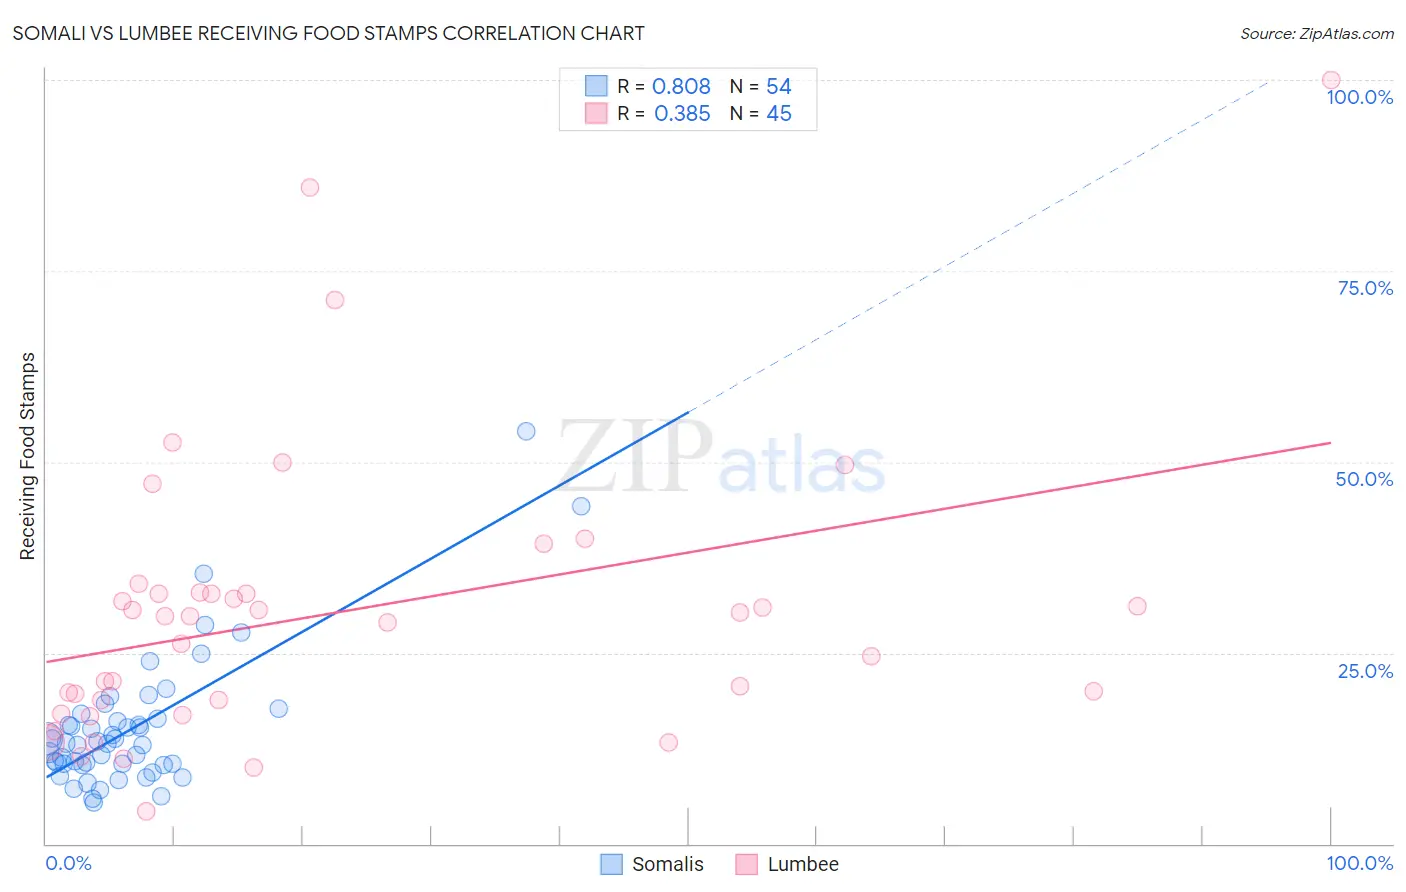
Somali vs Lumbee Receiving Food Stamps Correlation Chart
The statistical analysis conducted on geographies consisting of 99,256,962 people shows a very strong positive correlation between the proportion of Somalis and percentage of population receiving government assistance and/or food stamps in the United States with a correlation coefficient (R) of 0.808 and weighted average of 13.7%. Similarly, the statistical analysis conducted on geographies consisting of 92,196,215 people shows a mild positive correlation between the proportion of Lumbee and percentage of population receiving government assistance and/or food stamps in the United States with a correlation coefficient (R) of 0.385 and weighted average of 22.9%, a difference of 67.8%.
Receiving Food Stamps Correlation Summary
| Measurement | Somali | Lumbee |
| Minimum | 5.4% | 4.2% |
| Maximum | 54.0% | 100.0% |
| Range | 48.6% | 95.8% |
| Mean | 15.2% | 30.2% |
| Median | 13.1% | 29.7% |
| Interquartile 25% (IQ1) | 10.4% | 17.9% |
| Interquartile 75% (IQ3) | 16.3% | 32.8% |
| Interquartile Range (IQR) | 5.9% | 14.9% |
| Standard Deviation (Sample) | 9.0% | 18.9% |
| Standard Deviation (Population) | 8.9% | 18.7% |
Similar Demographics by Receiving Food Stamps
Demographics Similar to Somalis by Receiving Food Stamps
In terms of receiving food stamps, the demographic groups most similar to Somalis are Cajun (13.7%, a difference of 0.16%), Immigrants from Panama (13.6%, a difference of 0.19%), Immigrants from Somalia (13.7%, a difference of 0.20%), Choctaw (13.6%, a difference of 0.38%), and Cree (13.7%, a difference of 0.44%).
| Demographics | Rating | Rank | Receiving Food Stamps |
| Crow | 1.6 /100 | #236 | Tragic 13.4% |
| Immigrants | El Salvador | 1.5 /100 | #237 | Tragic 13.5% |
| French American Indians | 1.4 /100 | #238 | Tragic 13.5% |
| Immigrants | Micronesia | 1.3 /100 | #239 | Tragic 13.5% |
| Iroquois | 1.2 /100 | #240 | Tragic 13.5% |
| Choctaw | 1.0 /100 | #241 | Tragic 13.6% |
| Immigrants | Panama | 1.0 /100 | #242 | Tragic 13.6% |
| Somalis | 0.9 /100 | #243 | Tragic 13.7% |
| Cajuns | 0.9 /100 | #244 | Tragic 13.7% |
| Immigrants | Somalia | 0.9 /100 | #245 | Tragic 13.7% |
| Cree | 0.8 /100 | #246 | Tragic 13.7% |
| Mexican American Indians | 0.7 /100 | #247 | Tragic 13.8% |
| Immigrants | Laos | 0.7 /100 | #248 | Tragic 13.8% |
| Indonesians | 0.6 /100 | #249 | Tragic 13.9% |
| Immigrants | Cambodia | 0.5 /100 | #250 | Tragic 13.9% |
Demographics Similar to Lumbee by Receiving Food Stamps
In terms of receiving food stamps, the demographic groups most similar to Lumbee are Immigrants from Dominican Republic (22.1%, a difference of 3.6%), Immigrants from Cabo Verde (23.8%, a difference of 4.1%), Immigrants from Yemen (21.6%, a difference of 5.9%), Hopi (21.6%, a difference of 6.3%), and Tohono O'odham (21.5%, a difference of 6.7%).
| Demographics | Rating | Rank | Receiving Food Stamps |
| Inupiat | 0.0 /100 | #333 | Tragic 20.1% |
| Yuman | 0.0 /100 | #334 | Tragic 20.2% |
| Immigrants | Cuba | 0.0 /100 | #335 | Tragic 20.8% |
| Navajo | 0.0 /100 | #336 | Tragic 21.1% |
| Cape Verdeans | 0.0 /100 | #337 | Tragic 21.1% |
| Dominicans | 0.0 /100 | #338 | Tragic 21.4% |
| Yakama | 0.0 /100 | #339 | Tragic 21.4% |
| Tohono O'odham | 0.0 /100 | #340 | Tragic 21.5% |
| Hopi | 0.0 /100 | #341 | Tragic 21.6% |
| Immigrants | Yemen | 0.0 /100 | #342 | Tragic 21.6% |
| Immigrants | Dominican Republic | 0.0 /100 | #343 | Tragic 22.1% |
| Lumbee | 0.0 /100 | #344 | Tragic 22.9% |
| Immigrants | Cabo Verde | 0.0 /100 | #345 | Tragic 23.8% |
| Puerto Ricans | 0.0 /100 | #346 | Tragic 26.0% |
| Yup'ik | 0.0 /100 | #347 | Tragic 32.7% |