Somali vs Lumbee Ambulatory Disability
COMPARE
Somali
Lumbee
Ambulatory Disability
Ambulatory Disability Comparison
Somalis
Lumbee
5.7%
AMBULATORY DISABILITY
99.2/ 100
METRIC RATING
78th/ 347
METRIC RANK
9.5%
AMBULATORY DISABILITY
0.0/ 100
METRIC RATING
347th/ 347
METRIC RANK
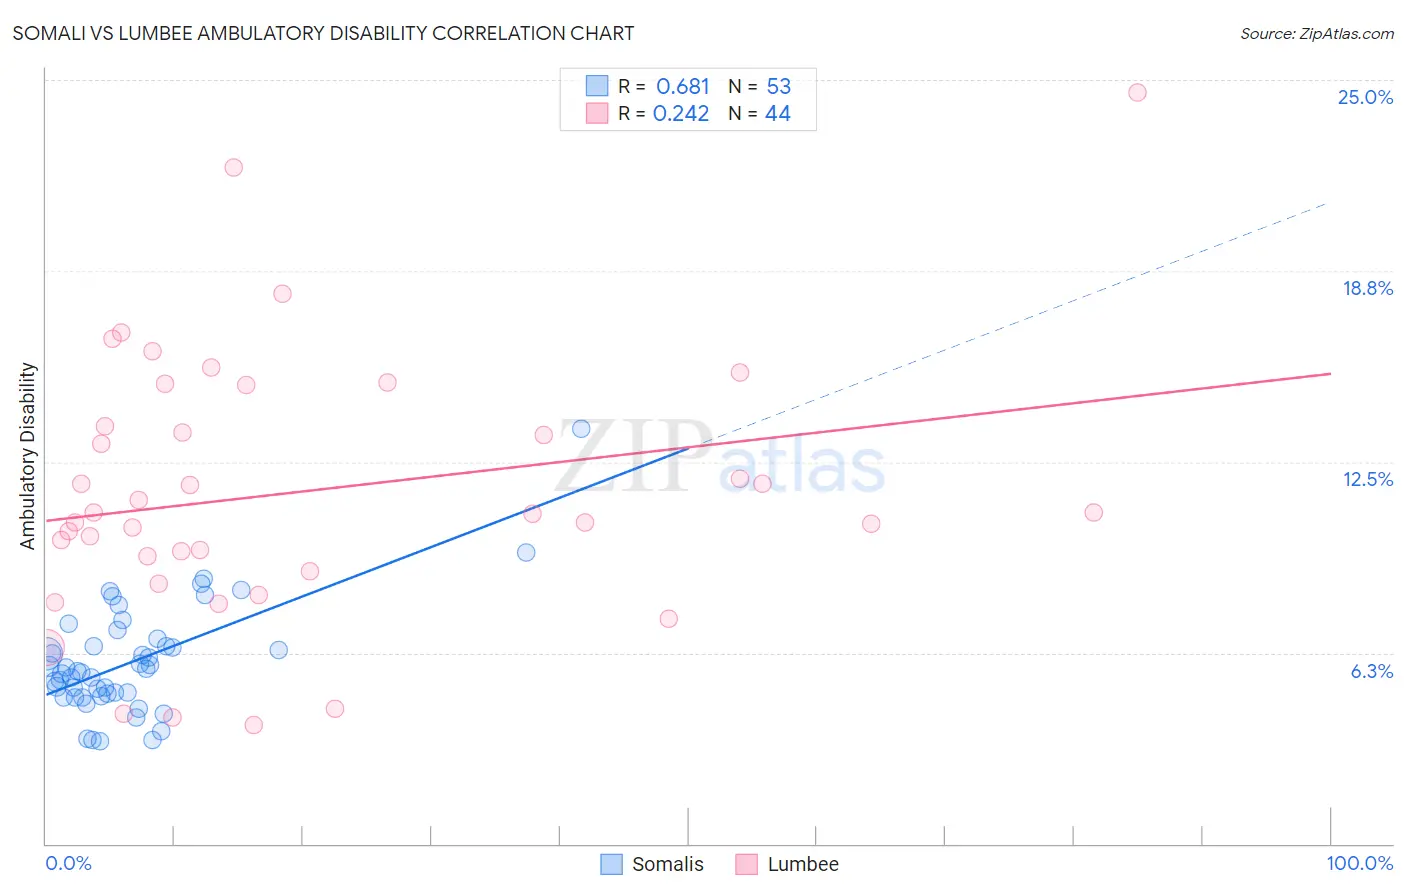
Somali vs Lumbee Ambulatory Disability Correlation Chart
The statistical analysis conducted on geographies consisting of 99,294,852 people shows a significant positive correlation between the proportion of Somalis and percentage of population with ambulatory disability in the United States with a correlation coefficient (R) of 0.681 and weighted average of 5.7%. Similarly, the statistical analysis conducted on geographies consisting of 92,273,744 people shows a weak positive correlation between the proportion of Lumbee and percentage of population with ambulatory disability in the United States with a correlation coefficient (R) of 0.242 and weighted average of 9.5%, a difference of 66.7%.
Ambulatory Disability Correlation Summary
| Measurement | Somali | Lumbee |
| Minimum | 3.3% | 3.9% |
| Maximum | 13.6% | 24.6% |
| Range | 10.2% | 20.7% |
| Mean | 6.0% | 11.5% |
| Median | 5.7% | 10.8% |
| Interquartile 25% (IQ1) | 4.9% | 9.2% |
| Interquartile 75% (IQ3) | 6.6% | 14.3% |
| Interquartile Range (IQR) | 1.7% | 5.2% |
| Standard Deviation (Sample) | 1.8% | 4.4% |
| Standard Deviation (Population) | 1.8% | 4.3% |
Similar Demographics by Ambulatory Disability
Demographics Similar to Somalis by Ambulatory Disability
In terms of ambulatory disability, the demographic groups most similar to Somalis are Immigrants from Vietnam (5.7%, a difference of 0.010%), Chilean (5.7%, a difference of 0.010%), Immigrants from Ireland (5.7%, a difference of 0.14%), Immigrants from Jordan (5.7%, a difference of 0.14%), and Palestinian (5.7%, a difference of 0.15%).
| Demographics | Rating | Rank | Ambulatory Disability |
| Immigrants | Peru | 99.4 /100 | #71 | Exceptional 5.7% |
| Brazilians | 99.4 /100 | #72 | Exceptional 5.7% |
| Immigrants | Northern Africa | 99.4 /100 | #73 | Exceptional 5.7% |
| Immigrants | Cameroon | 99.4 /100 | #74 | Exceptional 5.7% |
| Immigrants | South Africa | 99.3 /100 | #75 | Exceptional 5.7% |
| Sudanese | 99.3 /100 | #76 | Exceptional 5.7% |
| Immigrants | Vietnam | 99.3 /100 | #77 | Exceptional 5.7% |
| Somalis | 99.2 /100 | #78 | Exceptional 5.7% |
| Chileans | 99.2 /100 | #79 | Exceptional 5.7% |
| Immigrants | Ireland | 99.2 /100 | #80 | Exceptional 5.7% |
| Immigrants | Jordan | 99.2 /100 | #81 | Exceptional 5.7% |
| Palestinians | 99.2 /100 | #82 | Exceptional 5.7% |
| Eastern Europeans | 99.2 /100 | #83 | Exceptional 5.7% |
| Ugandans | 99.2 /100 | #84 | Exceptional 5.7% |
| South Americans | 99.0 /100 | #85 | Exceptional 5.7% |
Demographics Similar to Lumbee by Ambulatory Disability
In terms of ambulatory disability, the demographic groups most similar to Lumbee are Houma (9.3%, a difference of 2.5%), Puerto Rican (8.9%, a difference of 7.5%), Tsimshian (8.8%, a difference of 8.2%), Tohono O'odham (8.7%, a difference of 9.2%), and Kiowa (8.6%, a difference of 10.8%).
| Demographics | Rating | Rank | Ambulatory Disability |
| Cherokee | 0.0 /100 | #333 | Tragic 7.9% |
| Yuman | 0.0 /100 | #334 | Tragic 7.9% |
| Chickasaw | 0.0 /100 | #335 | Tragic 8.0% |
| Seminole | 0.0 /100 | #336 | Tragic 8.0% |
| Dutch West Indians | 0.0 /100 | #337 | Tragic 8.2% |
| Colville | 0.0 /100 | #338 | Tragic 8.2% |
| Pima | 0.0 /100 | #339 | Tragic 8.2% |
| Choctaw | 0.0 /100 | #340 | Tragic 8.3% |
| Creek | 0.0 /100 | #341 | Tragic 8.5% |
| Kiowa | 0.0 /100 | #342 | Tragic 8.6% |
| Tohono O'odham | 0.0 /100 | #343 | Tragic 8.7% |
| Tsimshian | 0.0 /100 | #344 | Tragic 8.8% |
| Puerto Ricans | 0.0 /100 | #345 | Tragic 8.9% |
| Houma | 0.0 /100 | #346 | Tragic 9.3% |
| Lumbee | 0.0 /100 | #347 | Tragic 9.5% |