Seminole vs German Single Female Poverty
COMPARE
Seminole
German
Single Female Poverty
Single Female Poverty Comparison
Seminole
Germans
26.8%
SINGLE FEMALE POVERTY
0.0/ 100
METRIC RATING
322nd/ 347
METRIC RANK
21.8%
SINGLE FEMALE POVERTY
8.3/ 100
METRIC RATING
220th/ 347
METRIC RANK
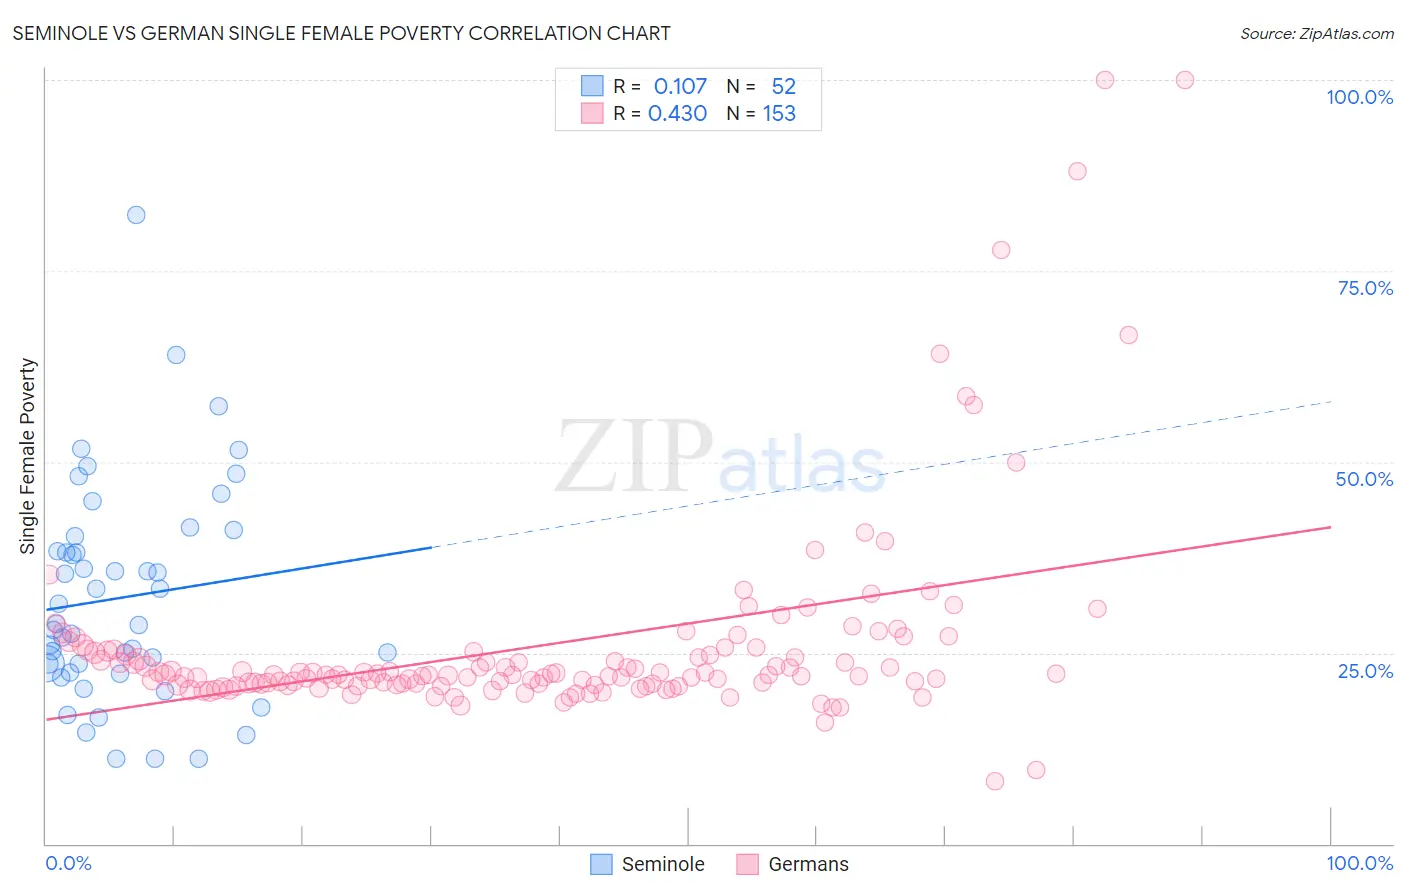
Seminole vs German Single Female Poverty Correlation Chart
The statistical analysis conducted on geographies consisting of 117,983,009 people shows a poor positive correlation between the proportion of Seminole and poverty level among single females in the United States with a correlation coefficient (R) of 0.107 and weighted average of 26.8%. Similarly, the statistical analysis conducted on geographies consisting of 558,181,228 people shows a moderate positive correlation between the proportion of Germans and poverty level among single females in the United States with a correlation coefficient (R) of 0.430 and weighted average of 21.8%, a difference of 23.0%.
Single Female Poverty Correlation Summary
| Measurement | Seminole | German |
| Minimum | 11.1% | 8.2% |
| Maximum | 82.4% | 100.0% |
| Range | 71.2% | 91.8% |
| Mean | 32.3% | 26.0% |
| Median | 28.7% | 22.1% |
| Interquartile 25% (IQ1) | 23.0% | 20.8% |
| Interquartile 75% (IQ3) | 39.2% | 25.2% |
| Interquartile Range (IQR) | 16.2% | 4.3% |
| Standard Deviation (Sample) | 14.2% | 13.4% |
| Standard Deviation (Population) | 14.1% | 13.4% |
Similar Demographics by Single Female Poverty
Demographics Similar to Seminole by Single Female Poverty
In terms of single female poverty, the demographic groups most similar to Seminole are Chippewa (26.8%, a difference of 0.10%), Kiowa (26.9%, a difference of 0.52%), Yup'ik (26.6%, a difference of 0.74%), Arapaho (26.4%, a difference of 1.4%), and Choctaw (27.2%, a difference of 1.5%).
| Demographics | Rating | Rank | Single Female Poverty |
| Iroquois | 0.0 /100 | #315 | Tragic 25.7% |
| Immigrants | Somalia | 0.0 /100 | #316 | Tragic 25.8% |
| Ottawa | 0.0 /100 | #317 | Tragic 26.0% |
| Chickasaw | 0.0 /100 | #318 | Tragic 26.3% |
| Blacks/African Americans | 0.0 /100 | #319 | Tragic 26.4% |
| Arapaho | 0.0 /100 | #320 | Tragic 26.4% |
| Yup'ik | 0.0 /100 | #321 | Tragic 26.6% |
| Seminole | 0.0 /100 | #322 | Tragic 26.8% |
| Chippewa | 0.0 /100 | #323 | Tragic 26.8% |
| Kiowa | 0.0 /100 | #324 | Tragic 26.9% |
| Choctaw | 0.0 /100 | #325 | Tragic 27.2% |
| Creek | 0.0 /100 | #326 | Tragic 27.4% |
| Dutch West Indians | 0.0 /100 | #327 | Tragic 27.5% |
| Apache | 0.0 /100 | #328 | Tragic 27.7% |
| Menominee | 0.0 /100 | #329 | Tragic 27.8% |
Demographics Similar to Germans by Single Female Poverty
In terms of single female poverty, the demographic groups most similar to Germans are Immigrants from Grenada (21.8%, a difference of 0.050%), Immigrants from Eritrea (21.8%, a difference of 0.070%), Panamanian (21.7%, a difference of 0.21%), Scottish (21.8%, a difference of 0.21%), and Barbadian (21.8%, a difference of 0.23%).
| Demographics | Rating | Rank | Single Female Poverty |
| Guamanians/Chamorros | 13.7 /100 | #213 | Poor 21.6% |
| Immigrants | Nicaragua | 13.3 /100 | #214 | Poor 21.6% |
| Ecuadorians | 12.3 /100 | #215 | Poor 21.6% |
| Immigrants | Barbados | 12.2 /100 | #216 | Poor 21.7% |
| Immigrants | St. Vincent and the Grenadines | 11.7 /100 | #217 | Poor 21.7% |
| Nepalese | 9.7 /100 | #218 | Tragic 21.7% |
| Panamanians | 9.4 /100 | #219 | Tragic 21.7% |
| Germans | 8.3 /100 | #220 | Tragic 21.8% |
| Immigrants | Grenada | 8.0 /100 | #221 | Tragic 21.8% |
| Immigrants | Eritrea | 7.9 /100 | #222 | Tragic 21.8% |
| Scottish | 7.3 /100 | #223 | Tragic 21.8% |
| Barbadians | 7.2 /100 | #224 | Tragic 21.8% |
| English | 6.4 /100 | #225 | Tragic 21.9% |
| Immigrants | Portugal | 5.8 /100 | #226 | Tragic 21.9% |
| Immigrants | Ghana | 5.8 /100 | #227 | Tragic 21.9% |