Peruvian vs Apache Cognitive Disability
COMPARE
Peruvian
Apache
Cognitive Disability
Cognitive Disability Comparison
Peruvians
Apache
16.7%
COGNITIVE DISABILITY
99.3/ 100
METRIC RATING
78th/ 347
METRIC RANK
18.6%
COGNITIVE DISABILITY
0.0/ 100
METRIC RATING
320th/ 347
METRIC RANK
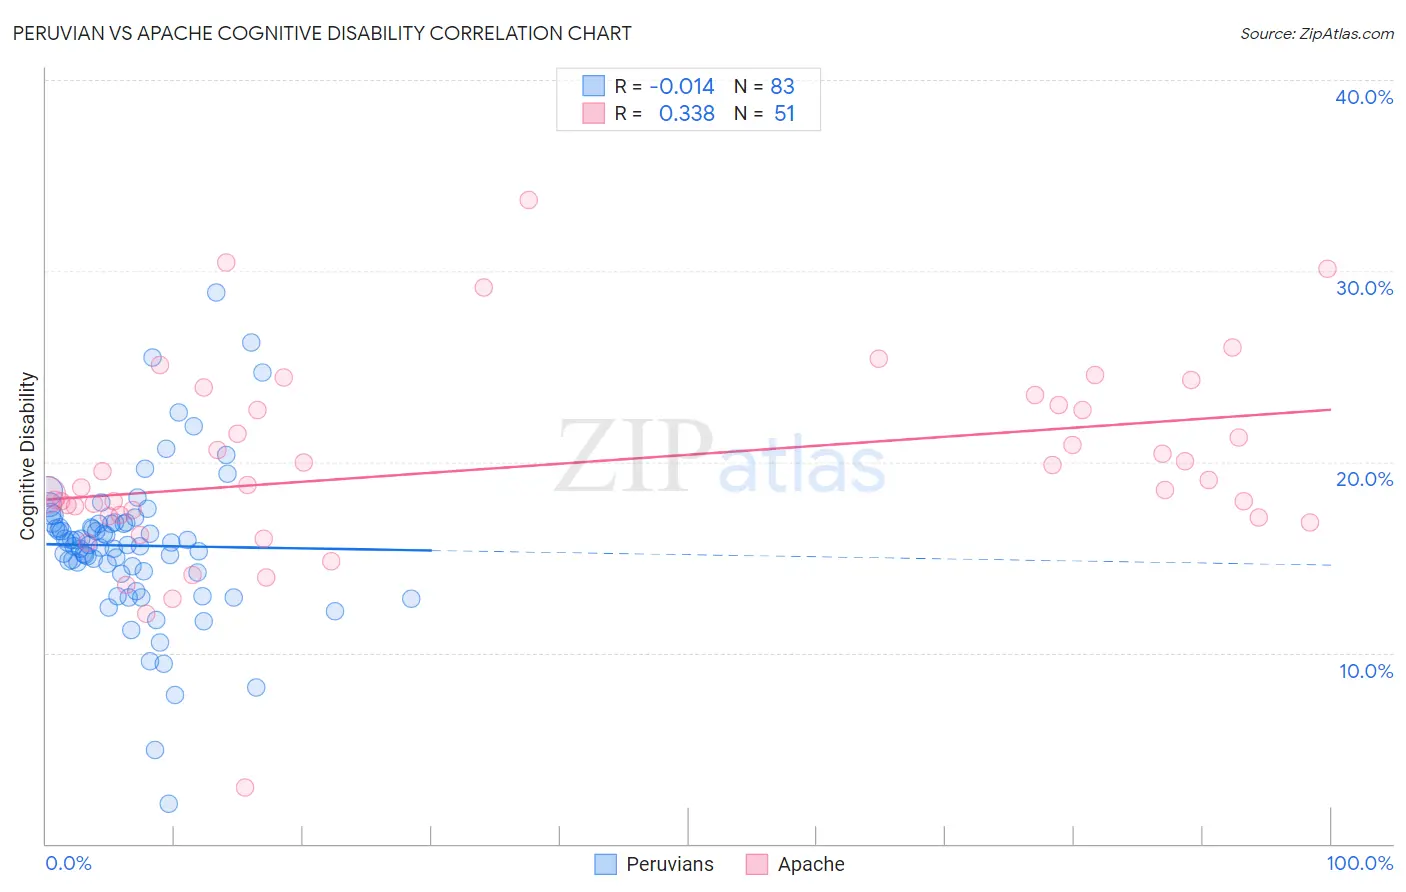
Peruvian vs Apache Cognitive Disability Correlation Chart
The statistical analysis conducted on geographies consisting of 363,189,902 people shows no correlation between the proportion of Peruvians and percentage of population with cognitive disability in the United States with a correlation coefficient (R) of -0.014 and weighted average of 16.7%. Similarly, the statistical analysis conducted on geographies consisting of 231,073,406 people shows a mild positive correlation between the proportion of Apache and percentage of population with cognitive disability in the United States with a correlation coefficient (R) of 0.338 and weighted average of 18.6%, a difference of 11.7%.
Cognitive Disability Correlation Summary
| Measurement | Peruvian | Apache |
| Minimum | 2.1% | 2.9% |
| Maximum | 28.9% | 33.7% |
| Range | 26.8% | 30.8% |
| Mean | 15.6% | 19.8% |
| Median | 15.7% | 18.8% |
| Interquartile 25% (IQ1) | 14.2% | 17.2% |
| Interquartile 75% (IQ3) | 16.8% | 23.0% |
| Interquartile Range (IQR) | 2.6% | 5.8% |
| Standard Deviation (Sample) | 4.0% | 5.2% |
| Standard Deviation (Population) | 4.0% | 5.2% |
Similar Demographics by Cognitive Disability
Demographics Similar to Peruvians by Cognitive Disability
In terms of cognitive disability, the demographic groups most similar to Peruvians are Immigrants from Hungary (16.7%, a difference of 0.0%), Immigrants from Serbia (16.7%, a difference of 0.010%), Immigrants from Bulgaria (16.7%, a difference of 0.010%), Estonian (16.7%, a difference of 0.030%), and Egyptian (16.7%, a difference of 0.030%).
| Demographics | Rating | Rank | Cognitive Disability |
| Immigrants | Belgium | 99.3 /100 | #71 | Exceptional 16.7% |
| Germans | 99.3 /100 | #72 | Exceptional 16.7% |
| Burmese | 99.3 /100 | #73 | Exceptional 16.7% |
| Slavs | 99.3 /100 | #74 | Exceptional 16.7% |
| Estonians | 99.3 /100 | #75 | Exceptional 16.7% |
| Immigrants | Serbia | 99.3 /100 | #76 | Exceptional 16.7% |
| Immigrants | Hungary | 99.3 /100 | #77 | Exceptional 16.7% |
| Peruvians | 99.3 /100 | #78 | Exceptional 16.7% |
| Immigrants | Bulgaria | 99.3 /100 | #79 | Exceptional 16.7% |
| Egyptians | 99.2 /100 | #80 | Exceptional 16.7% |
| Immigrants | Netherlands | 99.2 /100 | #81 | Exceptional 16.7% |
| Swiss | 99.2 /100 | #82 | Exceptional 16.7% |
| Serbians | 99.1 /100 | #83 | Exceptional 16.7% |
| Belgians | 99.1 /100 | #84 | Exceptional 16.7% |
| Immigrants | Moldova | 99.1 /100 | #85 | Exceptional 16.7% |
Demographics Similar to Apache by Cognitive Disability
In terms of cognitive disability, the demographic groups most similar to Apache are Comanche (18.6%, a difference of 0.040%), Bangladeshi (18.6%, a difference of 0.080%), African (18.6%, a difference of 0.090%), Immigrants from Liberia (18.7%, a difference of 0.16%), and Pueblo (18.7%, a difference of 0.17%).
| Demographics | Rating | Rank | Cognitive Disability |
| Yaqui | 0.0 /100 | #313 | Tragic 18.5% |
| Sub-Saharan Africans | 0.0 /100 | #314 | Tragic 18.5% |
| Immigrants | Dominica | 0.0 /100 | #315 | Tragic 18.6% |
| Immigrants | Middle Africa | 0.0 /100 | #316 | Tragic 18.6% |
| Liberians | 0.0 /100 | #317 | Tragic 18.6% |
| Bangladeshis | 0.0 /100 | #318 | Tragic 18.6% |
| Comanche | 0.0 /100 | #319 | Tragic 18.6% |
| Apache | 0.0 /100 | #320 | Tragic 18.6% |
| Africans | 0.0 /100 | #321 | Tragic 18.6% |
| Immigrants | Liberia | 0.0 /100 | #322 | Tragic 18.7% |
| Pueblo | 0.0 /100 | #323 | Tragic 18.7% |
| Dominicans | 0.0 /100 | #324 | Tragic 18.7% |
| Indonesians | 0.0 /100 | #325 | Tragic 18.7% |
| Immigrants | Senegal | 0.0 /100 | #326 | Tragic 18.7% |
| U.S. Virgin Islanders | 0.0 /100 | #327 | Tragic 18.7% |