Mexican vs Apache Married-Couple Family Poverty
COMPARE
Mexican
Apache
Married-Couple Family Poverty
Married-Couple Family Poverty Comparison
Mexicans
Apache
7.2%
MARRIED-COUPLE FAMILY POVERTY
0.0/ 100
METRIC RATING
317th/ 347
METRIC RANK
9.0%
MARRIED-COUPLE FAMILY POVERTY
0.0/ 100
METRIC RATING
336th/ 347
METRIC RANK
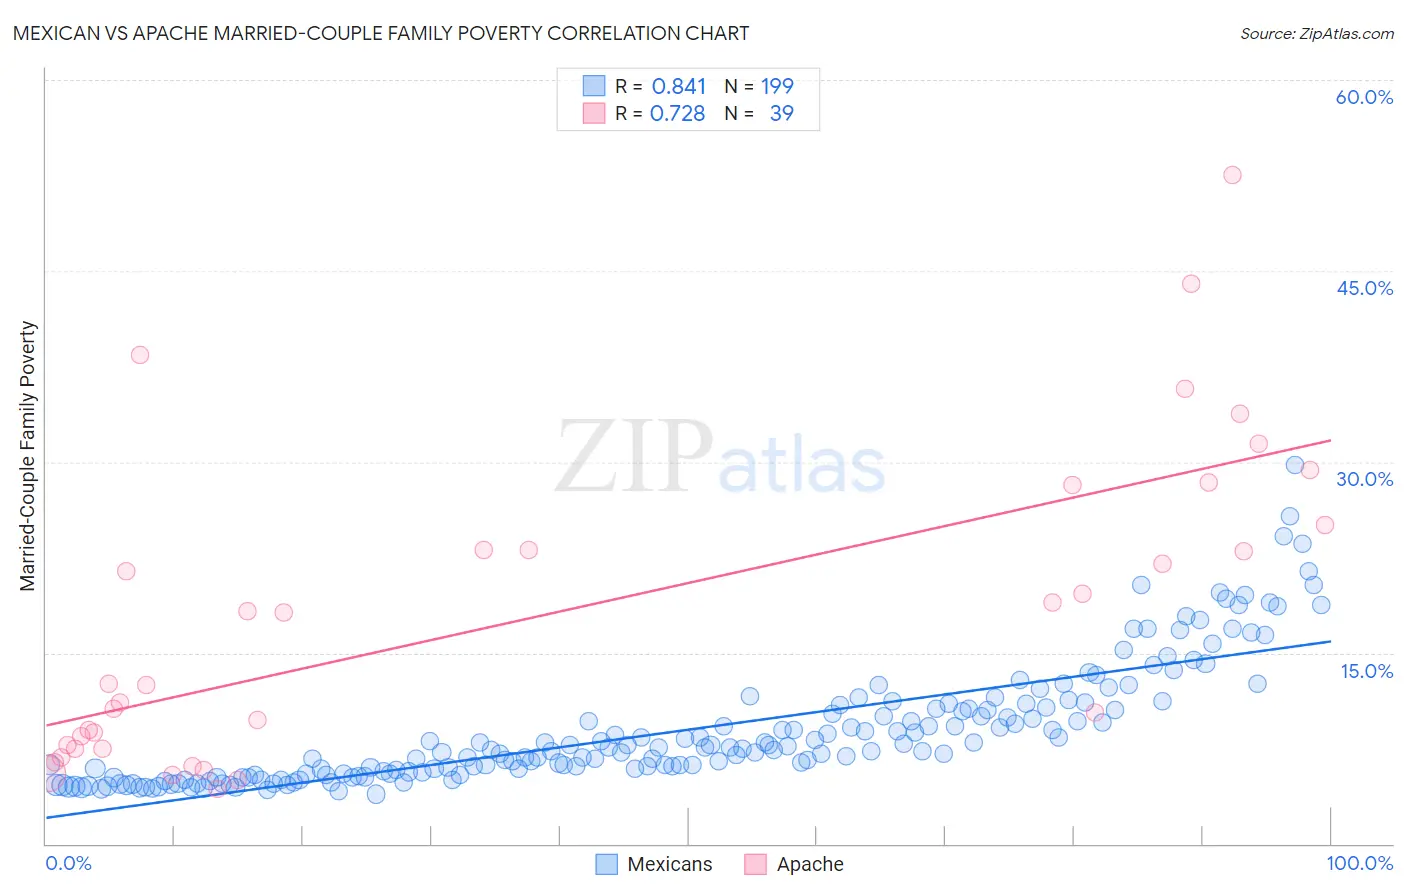
Mexican vs Apache Married-Couple Family Poverty Correlation Chart
The statistical analysis conducted on geographies consisting of 552,712,158 people shows a very strong positive correlation between the proportion of Mexicans and poverty level among married-couple families in the United States with a correlation coefficient (R) of 0.841 and weighted average of 7.2%. Similarly, the statistical analysis conducted on geographies consisting of 230,238,952 people shows a strong positive correlation between the proportion of Apache and poverty level among married-couple families in the United States with a correlation coefficient (R) of 0.728 and weighted average of 9.0%, a difference of 24.7%.
Married-Couple Family Poverty Correlation Summary
| Measurement | Mexican | Apache |
| Minimum | 3.9% | 4.3% |
| Maximum | 29.8% | 52.5% |
| Range | 25.9% | 48.2% |
| Mean | 8.9% | 17.8% |
| Median | 7.4% | 12.6% |
| Interquartile 25% (IQ1) | 5.5% | 7.5% |
| Interquartile 75% (IQ3) | 10.6% | 25.0% |
| Interquartile Range (IQR) | 5.1% | 17.5% |
| Standard Deviation (Sample) | 4.7% | 12.2% |
| Standard Deviation (Population) | 4.7% | 12.0% |
Demographics Similar to Mexicans and Apache by Married-Couple Family Poverty
In terms of married-couple family poverty, the demographic groups most similar to Mexicans are Immigrants from Guatemala (7.2%, a difference of 0.17%), Honduran (7.2%, a difference of 0.31%), Immigrants from Latin America (7.2%, a difference of 0.34%), Immigrants from Grenada (7.3%, a difference of 1.5%), and Immigrants from Caribbean (7.3%, a difference of 2.3%). Similarly, the demographic groups most similar to Apache are Sioux (8.7%, a difference of 2.9%), Immigrants from Dominican Republic (8.4%, a difference of 6.6%), Lumbee (8.3%, a difference of 7.3%), Dominican (8.3%, a difference of 7.8%), and Central American Indian (8.3%, a difference of 7.9%).
| Demographics | Rating | Rank | Married-Couple Family Poverty |
| Hondurans | 0.0 /100 | #316 | Tragic 7.2% |
| Mexicans | 0.0 /100 | #317 | Tragic 7.2% |
| Immigrants | Guatemala | 0.0 /100 | #318 | Tragic 7.2% |
| Immigrants | Latin America | 0.0 /100 | #319 | Tragic 7.2% |
| Immigrants | Grenada | 0.0 /100 | #320 | Tragic 7.3% |
| Immigrants | Caribbean | 0.0 /100 | #321 | Tragic 7.3% |
| Immigrants | Honduras | 0.0 /100 | #322 | Tragic 7.3% |
| Vietnamese | 0.0 /100 | #323 | Tragic 7.4% |
| Immigrants | Central America | 0.0 /100 | #324 | Tragic 7.4% |
| Immigrants | Cuba | 0.0 /100 | #325 | Tragic 7.5% |
| Immigrants | Bangladesh | 0.0 /100 | #326 | Tragic 7.5% |
| Hispanics or Latinos | 0.0 /100 | #327 | Tragic 7.5% |
| Immigrants | Mexico | 0.0 /100 | #328 | Tragic 7.6% |
| Natives/Alaskans | 0.0 /100 | #329 | Tragic 8.2% |
| Paiute | 0.0 /100 | #330 | Tragic 8.3% |
| Central American Indians | 0.0 /100 | #331 | Tragic 8.3% |
| Dominicans | 0.0 /100 | #332 | Tragic 8.3% |
| Lumbee | 0.0 /100 | #333 | Tragic 8.3% |
| Immigrants | Dominican Republic | 0.0 /100 | #334 | Tragic 8.4% |
| Sioux | 0.0 /100 | #335 | Tragic 8.7% |
| Apache | 0.0 /100 | #336 | Tragic 9.0% |