Pakistani vs Sri Lankan Single Female Poverty
COMPARE
Pakistani
Sri Lankan
Single Female Poverty
Single Female Poverty Comparison
Pakistanis
Sri Lankans
20.2%
SINGLE FEMALE POVERTY
92.1/ 100
METRIC RATING
131st/ 347
METRIC RANK
19.2%
SINGLE FEMALE POVERTY
99.6/ 100
METRIC RATING
59th/ 347
METRIC RANK
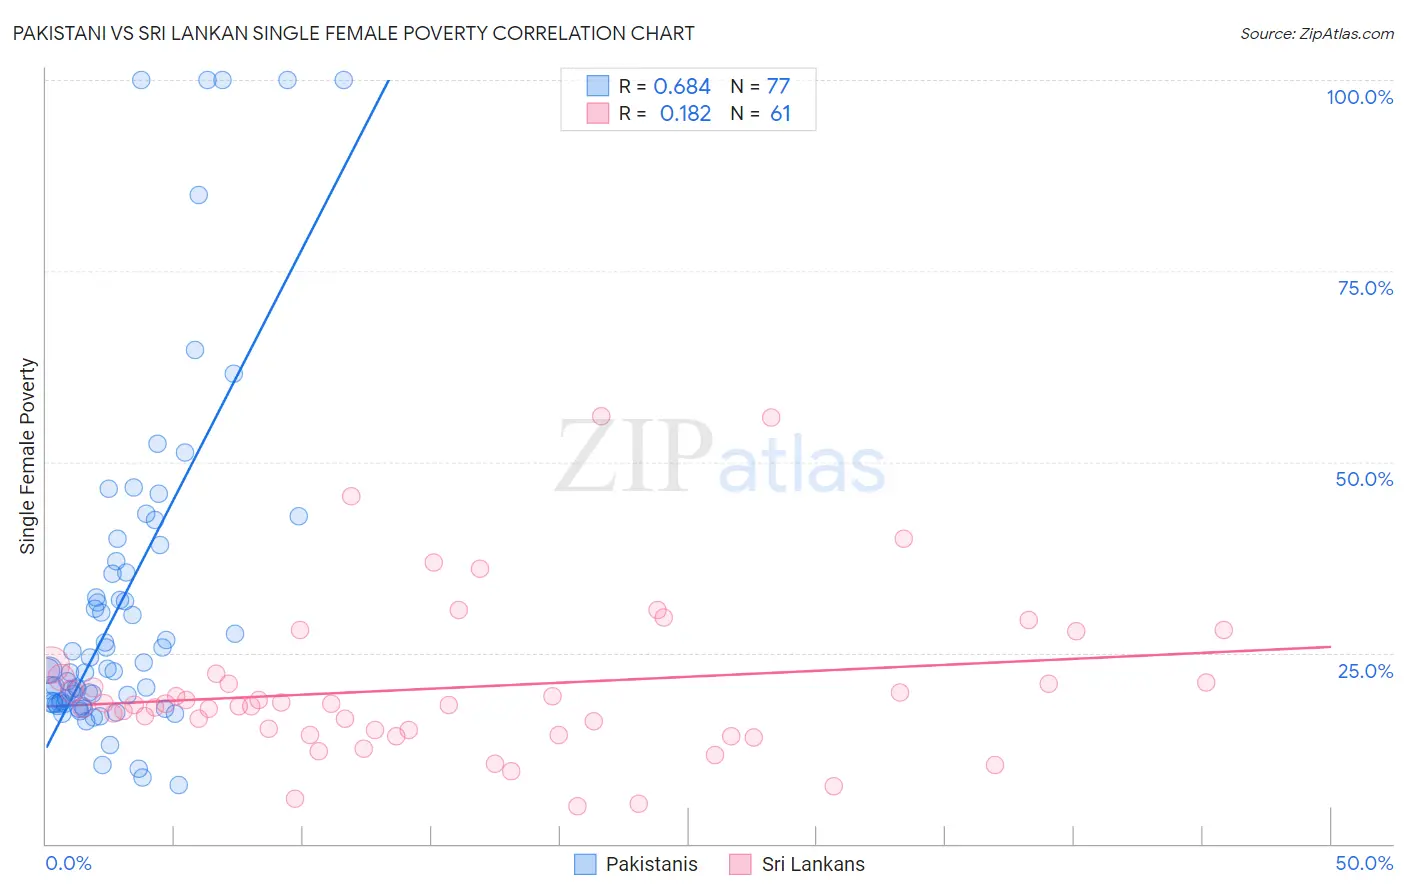
Pakistani vs Sri Lankan Single Female Poverty Correlation Chart
The statistical analysis conducted on geographies consisting of 331,803,446 people shows a significant positive correlation between the proportion of Pakistanis and poverty level among single females in the United States with a correlation coefficient (R) of 0.684 and weighted average of 20.2%. Similarly, the statistical analysis conducted on geographies consisting of 433,414,955 people shows a poor positive correlation between the proportion of Sri Lankans and poverty level among single females in the United States with a correlation coefficient (R) of 0.182 and weighted average of 19.2%, a difference of 5.4%.
Single Female Poverty Correlation Summary
| Measurement | Pakistani | Sri Lankan |
| Minimum | 7.7% | 4.9% |
| Maximum | 100.0% | 56.0% |
| Range | 92.3% | 51.1% |
| Mean | 31.6% | 20.4% |
| Median | 22.6% | 18.2% |
| Interquartile 25% (IQ1) | 18.4% | 14.6% |
| Interquartile 75% (IQ3) | 36.2% | 22.0% |
| Interquartile Range (IQR) | 17.8% | 7.5% |
| Standard Deviation (Sample) | 22.5% | 10.3% |
| Standard Deviation (Population) | 22.4% | 10.3% |
Similar Demographics by Single Female Poverty
Demographics Similar to Pakistanis by Single Female Poverty
In terms of single female poverty, the demographic groups most similar to Pakistanis are Uruguayan (20.2%, a difference of 0.0%), Immigrants from England (20.2%, a difference of 0.030%), Immigrants from Hungary (20.2%, a difference of 0.050%), Immigrants from Morocco (20.2%, a difference of 0.080%), and Immigrants from Venezuela (20.2%, a difference of 0.12%).
| Demographics | Rating | Rank | Single Female Poverty |
| Immigrants | Chile | 94.3 /100 | #124 | Exceptional 20.1% |
| Immigrants | South Africa | 93.9 /100 | #125 | Exceptional 20.1% |
| Serbians | 93.3 /100 | #126 | Exceptional 20.1% |
| Mongolians | 93.2 /100 | #127 | Exceptional 20.2% |
| Immigrants | Spain | 92.7 /100 | #128 | Exceptional 20.2% |
| Immigrants | Morocco | 92.4 /100 | #129 | Exceptional 20.2% |
| Immigrants | Hungary | 92.3 /100 | #130 | Exceptional 20.2% |
| Pakistanis | 92.1 /100 | #131 | Exceptional 20.2% |
| Uruguayans | 92.1 /100 | #132 | Exceptional 20.2% |
| Immigrants | England | 91.9 /100 | #133 | Exceptional 20.2% |
| Immigrants | Venezuela | 91.5 /100 | #134 | Exceptional 20.2% |
| Immigrants | Iraq | 91.2 /100 | #135 | Exceptional 20.2% |
| Immigrants | Canada | 91.2 /100 | #136 | Exceptional 20.2% |
| Immigrants | Nepal | 90.6 /100 | #137 | Exceptional 20.3% |
| Slovenes | 90.5 /100 | #138 | Exceptional 20.3% |
Demographics Similar to Sri Lankans by Single Female Poverty
In terms of single female poverty, the demographic groups most similar to Sri Lankans are Immigrants from Bulgaria (19.1%, a difference of 0.10%), Russian (19.2%, a difference of 0.10%), Cambodian (19.2%, a difference of 0.12%), Lithuanian (19.2%, a difference of 0.17%), and Eastern European (19.1%, a difference of 0.22%).
| Demographics | Rating | Rank | Single Female Poverty |
| Egyptians | 99.7 /100 | #52 | Exceptional 19.1% |
| Tsimshian | 99.7 /100 | #53 | Exceptional 19.1% |
| Argentineans | 99.7 /100 | #54 | Exceptional 19.1% |
| Immigrants | Vietnam | 99.7 /100 | #55 | Exceptional 19.1% |
| Immigrants | Fiji | 99.7 /100 | #56 | Exceptional 19.1% |
| Eastern Europeans | 99.7 /100 | #57 | Exceptional 19.1% |
| Immigrants | Bulgaria | 99.7 /100 | #58 | Exceptional 19.1% |
| Sri Lankans | 99.6 /100 | #59 | Exceptional 19.2% |
| Russians | 99.6 /100 | #60 | Exceptional 19.2% |
| Cambodians | 99.6 /100 | #61 | Exceptional 19.2% |
| Lithuanians | 99.6 /100 | #62 | Exceptional 19.2% |
| Immigrants | Northern Europe | 99.6 /100 | #63 | Exceptional 19.2% |
| Immigrants | Europe | 99.6 /100 | #64 | Exceptional 19.2% |
| Cypriots | 99.6 /100 | #65 | Exceptional 19.2% |
| Palestinians | 99.6 /100 | #66 | Exceptional 19.2% |