Immigrants from Cabo Verde vs Sri Lankan Single Female Poverty
COMPARE
Immigrants from Cabo Verde
Sri Lankan
Single Female Poverty
Single Female Poverty Comparison
Immigrants from Cabo Verde
Sri Lankans
22.8%
SINGLE FEMALE POVERTY
0.4/ 100
METRIC RATING
261st/ 347
METRIC RANK
19.2%
SINGLE FEMALE POVERTY
99.6/ 100
METRIC RATING
59th/ 347
METRIC RANK
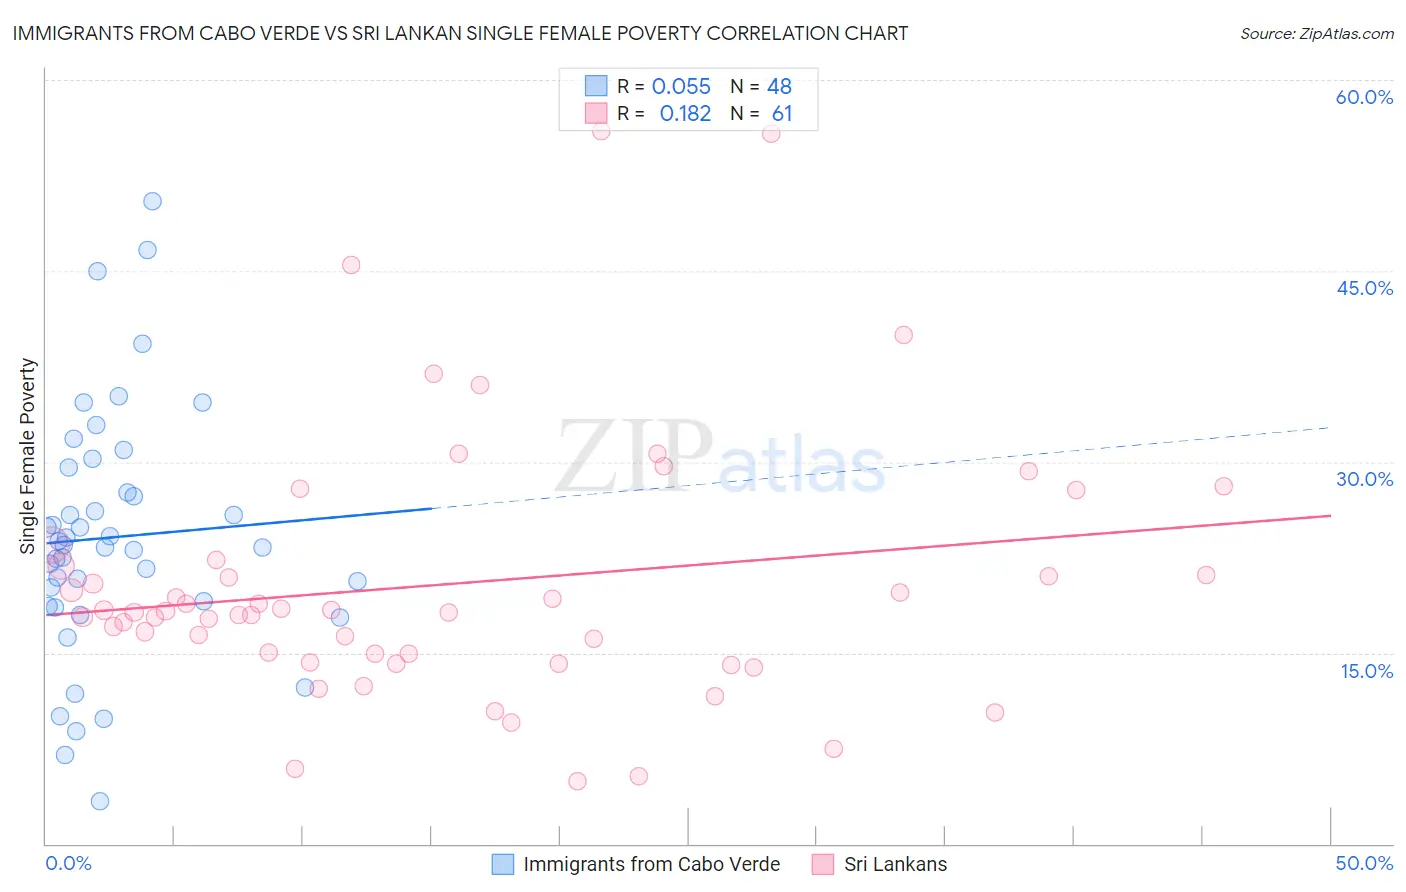
Immigrants from Cabo Verde vs Sri Lankan Single Female Poverty Correlation Chart
The statistical analysis conducted on geographies consisting of 38,021,113 people shows a slight positive correlation between the proportion of Immigrants from Cabo Verde and poverty level among single females in the United States with a correlation coefficient (R) of 0.055 and weighted average of 22.8%. Similarly, the statistical analysis conducted on geographies consisting of 433,414,955 people shows a poor positive correlation between the proportion of Sri Lankans and poverty level among single females in the United States with a correlation coefficient (R) of 0.182 and weighted average of 19.2%, a difference of 18.9%.
Single Female Poverty Correlation Summary
| Measurement | Immigrants from Cabo Verde | Sri Lankan |
| Minimum | 3.4% | 4.9% |
| Maximum | 50.5% | 56.0% |
| Range | 47.1% | 51.1% |
| Mean | 24.1% | 20.4% |
| Median | 23.4% | 18.2% |
| Interquartile 25% (IQ1) | 18.9% | 14.6% |
| Interquartile 75% (IQ3) | 28.6% | 22.0% |
| Interquartile Range (IQR) | 9.7% | 7.5% |
| Standard Deviation (Sample) | 9.7% | 10.3% |
| Standard Deviation (Population) | 9.6% | 10.3% |
Similar Demographics by Single Female Poverty
Demographics Similar to Immigrants from Cabo Verde by Single Female Poverty
In terms of single female poverty, the demographic groups most similar to Immigrants from Cabo Verde are British West Indian (22.8%, a difference of 0.25%), Celtic (22.7%, a difference of 0.27%), White/Caucasian (22.7%, a difference of 0.34%), Bahamian (22.7%, a difference of 0.48%), and Scotch-Irish (22.9%, a difference of 0.66%).
| Demographics | Rating | Rank | Single Female Poverty |
| Immigrants | Burma/Myanmar | 0.8 /100 | #254 | Tragic 22.6% |
| Immigrants | Sudan | 0.8 /100 | #255 | Tragic 22.6% |
| Immigrants | Belize | 0.8 /100 | #256 | Tragic 22.6% |
| Sudanese | 0.7 /100 | #257 | Tragic 22.6% |
| Bahamians | 0.6 /100 | #258 | Tragic 22.7% |
| Whites/Caucasians | 0.6 /100 | #259 | Tragic 22.7% |
| Celtics | 0.5 /100 | #260 | Tragic 22.7% |
| Immigrants | Cabo Verde | 0.4 /100 | #261 | Tragic 22.8% |
| British West Indians | 0.4 /100 | #262 | Tragic 22.8% |
| Scotch-Irish | 0.3 /100 | #263 | Tragic 22.9% |
| Immigrants | Laos | 0.3 /100 | #264 | Tragic 22.9% |
| Central Americans | 0.2 /100 | #265 | Tragic 23.0% |
| Immigrants | Micronesia | 0.2 /100 | #266 | Tragic 23.0% |
| Senegalese | 0.2 /100 | #267 | Tragic 23.0% |
| Fijians | 0.2 /100 | #268 | Tragic 23.1% |
Demographics Similar to Sri Lankans by Single Female Poverty
In terms of single female poverty, the demographic groups most similar to Sri Lankans are Immigrants from Bulgaria (19.1%, a difference of 0.10%), Russian (19.2%, a difference of 0.10%), Cambodian (19.2%, a difference of 0.12%), Lithuanian (19.2%, a difference of 0.17%), and Eastern European (19.1%, a difference of 0.22%).
| Demographics | Rating | Rank | Single Female Poverty |
| Egyptians | 99.7 /100 | #52 | Exceptional 19.1% |
| Tsimshian | 99.7 /100 | #53 | Exceptional 19.1% |
| Argentineans | 99.7 /100 | #54 | Exceptional 19.1% |
| Immigrants | Vietnam | 99.7 /100 | #55 | Exceptional 19.1% |
| Immigrants | Fiji | 99.7 /100 | #56 | Exceptional 19.1% |
| Eastern Europeans | 99.7 /100 | #57 | Exceptional 19.1% |
| Immigrants | Bulgaria | 99.7 /100 | #58 | Exceptional 19.1% |
| Sri Lankans | 99.6 /100 | #59 | Exceptional 19.2% |
| Russians | 99.6 /100 | #60 | Exceptional 19.2% |
| Cambodians | 99.6 /100 | #61 | Exceptional 19.2% |
| Lithuanians | 99.6 /100 | #62 | Exceptional 19.2% |
| Immigrants | Northern Europe | 99.6 /100 | #63 | Exceptional 19.2% |
| Immigrants | Europe | 99.6 /100 | #64 | Exceptional 19.2% |
| Cypriots | 99.6 /100 | #65 | Exceptional 19.2% |
| Palestinians | 99.6 /100 | #66 | Exceptional 19.2% |