Pakistani vs New Zealander Single Female Poverty
COMPARE
Pakistani
New Zealander
Single Female Poverty
Single Female Poverty Comparison
Pakistanis
New Zealanders
20.2%
SINGLE FEMALE POVERTY
92.1/ 100
METRIC RATING
131st/ 347
METRIC RANK
21.0%
SINGLE FEMALE POVERTY
53.2/ 100
METRIC RATING
170th/ 347
METRIC RANK
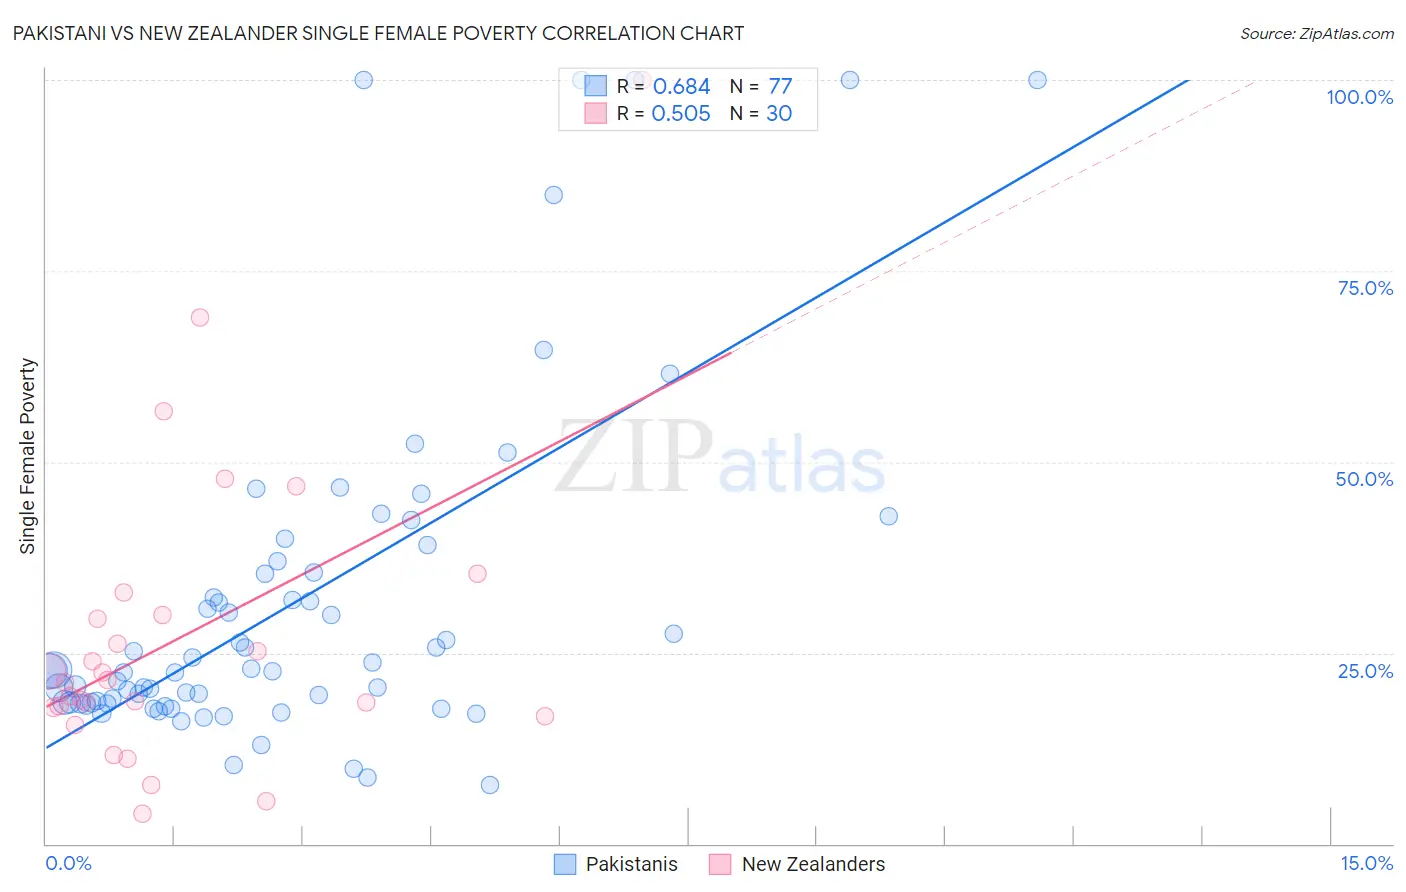
Pakistani vs New Zealander Single Female Poverty Correlation Chart
The statistical analysis conducted on geographies consisting of 331,803,446 people shows a significant positive correlation between the proportion of Pakistanis and poverty level among single females in the United States with a correlation coefficient (R) of 0.684 and weighted average of 20.2%. Similarly, the statistical analysis conducted on geographies consisting of 106,229,490 people shows a substantial positive correlation between the proportion of New Zealanders and poverty level among single females in the United States with a correlation coefficient (R) of 0.505 and weighted average of 21.0%, a difference of 3.8%.
Single Female Poverty Correlation Summary
| Measurement | Pakistani | New Zealander |
| Minimum | 7.7% | 3.9% |
| Maximum | 100.0% | 100.0% |
| Range | 92.3% | 96.1% |
| Mean | 31.6% | 27.1% |
| Median | 22.6% | 21.3% |
| Interquartile 25% (IQ1) | 18.4% | 17.8% |
| Interquartile 75% (IQ3) | 36.2% | 29.9% |
| Interquartile Range (IQR) | 17.8% | 12.0% |
| Standard Deviation (Sample) | 22.5% | 20.0% |
| Standard Deviation (Population) | 22.4% | 19.7% |
Similar Demographics by Single Female Poverty
Demographics Similar to Pakistanis by Single Female Poverty
In terms of single female poverty, the demographic groups most similar to Pakistanis are Uruguayan (20.2%, a difference of 0.0%), Immigrants from England (20.2%, a difference of 0.030%), Immigrants from Hungary (20.2%, a difference of 0.050%), Immigrants from Morocco (20.2%, a difference of 0.080%), and Immigrants from Venezuela (20.2%, a difference of 0.12%).
| Demographics | Rating | Rank | Single Female Poverty |
| Immigrants | Chile | 94.3 /100 | #124 | Exceptional 20.1% |
| Immigrants | South Africa | 93.9 /100 | #125 | Exceptional 20.1% |
| Serbians | 93.3 /100 | #126 | Exceptional 20.1% |
| Mongolians | 93.2 /100 | #127 | Exceptional 20.2% |
| Immigrants | Spain | 92.7 /100 | #128 | Exceptional 20.2% |
| Immigrants | Morocco | 92.4 /100 | #129 | Exceptional 20.2% |
| Immigrants | Hungary | 92.3 /100 | #130 | Exceptional 20.2% |
| Pakistanis | 92.1 /100 | #131 | Exceptional 20.2% |
| Uruguayans | 92.1 /100 | #132 | Exceptional 20.2% |
| Immigrants | England | 91.9 /100 | #133 | Exceptional 20.2% |
| Immigrants | Venezuela | 91.5 /100 | #134 | Exceptional 20.2% |
| Immigrants | Iraq | 91.2 /100 | #135 | Exceptional 20.2% |
| Immigrants | Canada | 91.2 /100 | #136 | Exceptional 20.2% |
| Immigrants | Nepal | 90.6 /100 | #137 | Exceptional 20.3% |
| Slovenes | 90.5 /100 | #138 | Exceptional 20.3% |
Demographics Similar to New Zealanders by Single Female Poverty
In terms of single female poverty, the demographic groups most similar to New Zealanders are Moroccan (21.0%, a difference of 0.020%), Guyanese (21.0%, a difference of 0.070%), Immigrants from Guyana (21.0%, a difference of 0.16%), Immigrants from Trinidad and Tobago (20.9%, a difference of 0.20%), and Cuban (21.0%, a difference of 0.20%).
| Demographics | Rating | Rank | Single Female Poverty |
| Lebanese | 67.6 /100 | #163 | Good 20.8% |
| Iraqis | 64.5 /100 | #164 | Good 20.8% |
| Ugandans | 64.0 /100 | #165 | Good 20.8% |
| Norwegians | 63.0 /100 | #166 | Good 20.8% |
| Immigrants | Norway | 63.0 /100 | #167 | Good 20.8% |
| Immigrants | Costa Rica | 61.5 /100 | #168 | Good 20.9% |
| Immigrants | Trinidad and Tobago | 56.3 /100 | #169 | Average 20.9% |
| New Zealanders | 53.2 /100 | #170 | Average 21.0% |
| Moroccans | 52.8 /100 | #171 | Average 21.0% |
| Guyanese | 52.0 /100 | #172 | Average 21.0% |
| Immigrants | Guyana | 50.6 /100 | #173 | Average 21.0% |
| Cubans | 50.0 /100 | #174 | Average 21.0% |
| Czechs | 46.8 /100 | #175 | Average 21.0% |
| Canadians | 45.4 /100 | #176 | Average 21.1% |
| Scandinavians | 45.2 /100 | #177 | Average 21.1% |