Pakistani vs Cypriot Single Female Poverty

COMPARE

Pakistani
Race
Ancestry
AfghanAfricanAlaska NativeAlaskan AthabascanAlbanianAleutAlsatianAmericanApacheArabArapahoArgentineanArmenianAssyrian/Chaldean/SyriacAustralianAustrianBahamianBangladeshiBarbadianBasqueBelgianBelizeanBermudanBhutaneseBlackfeetBolivianBrazilianBritishBritish West IndianBulgarianBurmeseCajunCambodianCanadianCape VerdeanCarpatho RusynCelticCentral AmericanCentral American IndianCherokeeCheyenneChickasawChileanChineseChippewaChoctawColombianColvilleComancheCosta RicanCreeCreekCroatianCrowCubanCzechCzechoslovakianDanishDelawareDominicanDutchDutch West IndianEastern EuropeanEcuadorianEgyptianEnglishEstonianEthiopianEuropeanFijianFilipinoFinnishFrenchFrench American IndianFrench CanadianGermanGerman RussianGhanaianGreekGuamanian/ChamorroGuatemalanGuyaneseHaitianHmongHonduranHopiHoumaHungarianIcelanderIndian (Asian)IndonesianInupiatIranianIraqiIrishIroquoisIsraeliItalianJamaicanJapaneseJordanianKenyanKiowaKoreanLaotianLatvianLebaneseLiberianLithuanianLumbeeLuxembourgerMacedonianMalaysianMalteseMarshalleseMenomineeMexicanMexican American IndianMongolianMoroccanNative HawaiianNavajoNepaleseNew ZealanderNicaraguanNigerianNorthern EuropeanNorwegianOkinawanOsageOttawaPaiutePakistaniPalestinianPanamanianParaguayanPennsylvania GermanPeruvianPimaPolishPortuguesePotawatomiPuebloPuerto RicanPuget Sound SalishRomanianRussianSalvadoranSamoanScandinavianScotch-IrishScottishSeminoleSenegaleseSerbianShoshoneSierra LeoneanSiouxSlavicSlovakSloveneSomaliSouth AfricanSouth AmericanSouth American IndianSoviet UnionSpaniardSpanishSpanish AmericanSpanish American IndianSri LankanSubsaharan AfricanSudaneseSwedishSwissSyrianTaiwaneseThaiTlingit-HaidaTohono O'OdhamTonganTrinidadian and TobagonianTsimshianTurkishU.S. Virgin IslanderUgandanUkrainianUruguayanUteVenezuelanVietnameseWelshWest IndianYakamaYaquiYugoslavianYumanYup'ikZimbabwean
Immigration
NonimmigrantsImmigrantsAfghanistanAfricaAlbaniaArgentinaArmeniaAsiaAustraliaAustriaBahamasBangladeshBarbadosBelarusBelgiumBelizeBoliviaBosnia and HerzegovinaBrazilBulgariaBurma/MyanmarCabo VerdeCambodiaCameroonCanadaCaribbeanCentral AmericaChileChinaColombiaCongoCosta RicaCroatiaCubaCzechoslovakiaDenmarkDominicaDominican RepublicEastern AfricaEastern AsiaEastern EuropeEcuadorEgyptEl SalvadorEnglandEritreaEthiopiaEuropeFijiFranceGermanyGhanaGreeceGrenadaGuatemalaGuyanaHaitiHondurasHong KongHungaryIndiaIndonesiaIranIraqIrelandIsraelItalyJamaicaJapanJordanKazakhstanKenyaKoreaKuwaitLaosLatin AmericaLatviaLebanonLiberiaLithuaniaMalaysiaMexicoMicronesiaMiddle AfricaMoldovaMoroccoNepalNetherlandsNicaraguaNigeriaNorth AmericaNorth MacedoniaNorthern AfricaNorthern EuropeNorwayOceaniaPakistanPanamaPeruPhilippinesPolandPortugalRomaniaRussiaSaudi ArabiaScotlandSenegalSerbiaSierra LeoneSingaporeSomaliaSouth AfricaSouth AmericaSouth Central AsiaSouth Eastern AsiaSouthern EuropeSpainSri LankaSt. Vincent and the GrenadinesSudanSwedenSwitzerlandSyriaTaiwanThailandTrinidad and TobagoTurkeyUgandaUkraineUruguayUzbekistanVenezuelaVietnamWest IndiesWestern AfricaWestern AsiaWestern EuropeYemenZaireZimbabweAzores
Cypriot
Race
Ancestry
AfghanAfricanAlaska NativeAlaskan AthabascanAlbanianAleutAlsatianAmericanApacheArabArapahoArgentineanArmenianAssyrian/Chaldean/SyriacAustralianAustrianBahamianBangladeshiBarbadianBasqueBelgianBelizeanBermudanBhutaneseBlackfeetBolivianBrazilianBritishBritish West IndianBulgarianBurmeseCajunCambodianCanadianCape VerdeanCarpatho RusynCelticCentral AmericanCentral American IndianCherokeeCheyenneChickasawChileanChineseChippewaChoctawColombianColvilleComancheCosta RicanCreeCreekCroatianCrowCubanCypriotCzechCzechoslovakianDanishDelawareDominicanDutchDutch West IndianEastern EuropeanEcuadorianEgyptianEnglishEstonianEthiopianEuropeanFijianFilipinoFinnishFrenchFrench American IndianFrench CanadianGermanGerman RussianGhanaianGreekGuamanian/ChamorroGuatemalanGuyaneseHaitianHmongHonduranHopiHoumaHungarianIcelanderIndian (Asian)IndonesianInupiatIranianIraqiIrishIroquoisIsraeliItalianJamaicanJapaneseJordanianKenyanKiowaKoreanLaotianLatvianLebaneseLiberianLithuanianLumbeeLuxembourgerMacedonianMalaysianMalteseMarshalleseMenomineeMexicanMexican American IndianMongolianMoroccanNative HawaiianNavajoNepaleseNew ZealanderNicaraguanNigerianNorthern EuropeanNorwegianOkinawanOsageOttawaPaiutePalestinianPanamanianParaguayanPennsylvania GermanPeruvianPimaPolishPortuguesePotawatomiPuebloPuerto RicanPuget Sound SalishRomanianRussianSalvadoranSamoanScandinavianScotch-IrishScottishSeminoleSenegaleseSerbianShoshoneSierra LeoneanSiouxSlavicSlovakSloveneSomaliSouth AfricanSouth AmericanSouth American IndianSoviet UnionSpaniardSpanishSpanish AmericanSpanish American IndianSri LankanSubsaharan AfricanSudaneseSwedishSwissSyrianTaiwaneseThaiTlingit-HaidaTohono O'OdhamTonganTrinidadian and TobagonianTsimshianTurkishU.S. Virgin IslanderUgandanUkrainianUruguayanUteVenezuelanVietnameseWelshWest IndianYakamaYaquiYugoslavianYumanYup'ikZimbabwean
Immigration
NonimmigrantsImmigrantsAfghanistanAfricaAlbaniaArgentinaArmeniaAsiaAustraliaAustriaBahamasBangladeshBarbadosBelarusBelgiumBelizeBoliviaBosnia and HerzegovinaBrazilBulgariaBurma/MyanmarCabo VerdeCambodiaCameroonCanadaCaribbeanCentral AmericaChileChinaColombiaCongoCosta RicaCroatiaCubaCzechoslovakiaDenmarkDominicaDominican RepublicEastern AfricaEastern AsiaEastern EuropeEcuadorEgyptEl SalvadorEnglandEritreaEthiopiaEuropeFijiFranceGermanyGhanaGreeceGrenadaGuatemalaGuyanaHaitiHondurasHong KongHungaryIndiaIndonesiaIranIraqIrelandIsraelItalyJamaicaJapanJordanKazakhstanKenyaKoreaKuwaitLaosLatin AmericaLatviaLebanonLiberiaLithuaniaMalaysiaMexicoMicronesiaMiddle AfricaMoldovaMoroccoNepalNetherlandsNicaraguaNigeriaNorth AmericaNorth MacedoniaNorthern AfricaNorthern EuropeNorwayOceaniaPakistanPanamaPeruPhilippinesPolandPortugalRomaniaRussiaSaudi ArabiaScotlandSenegalSerbiaSierra LeoneSingaporeSomaliaSouth AfricaSouth AmericaSouth Central AsiaSouth Eastern AsiaSouthern EuropeSpainSri LankaSt. Vincent and the GrenadinesSudanSwedenSwitzerlandSyriaTaiwanThailandTrinidad and TobagoTurkeyUgandaUkraineUruguayUzbekistanVenezuelaVietnamWest IndiesWestern AfricaWestern AsiaWestern EuropeYemenZaireZimbabweAzores
Single Female Poverty
Income
Poverty
Unemployment
Labor Participation
Family Structure
Vehicle Availability
Education Level
Disability

Single Female Poverty Comparison

Pakistanis

Cypriots

Exceptional
Exceptional
20.2%
SINGLE FEMALE POVERTY
92.1/ 100
METRIC RATING
131st/ 347
METRIC RANK
19.2%
SINGLE FEMALE POVERTY
99.6/ 100
METRIC RATING
65th/ 347
METRIC RANK

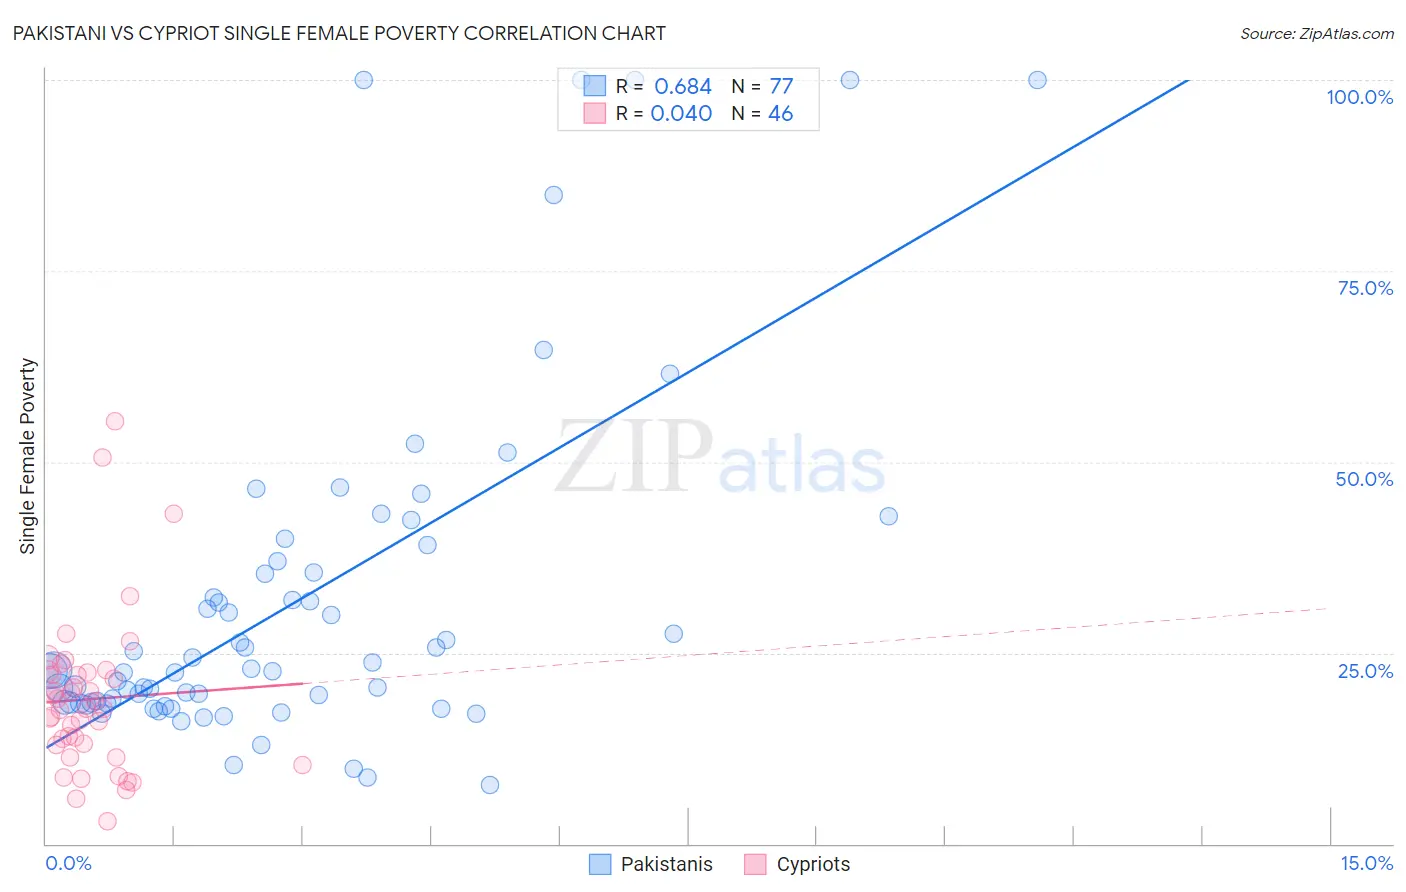
Pakistani vs Cypriot Single Female Poverty Correlation Chart

The statistical analysis conducted on geographies consisting of 331,803,446 people shows a significant positive correlation between the proportion of Pakistanis and poverty level among single females in the United States with a correlation coefficient (R) of 0.684 and weighted average of 20.2%. Similarly, the statistical analysis conducted on geographies consisting of 61,401,008 people shows no correlation between the proportion of Cypriots and poverty level among single females in the United States with a correlation coefficient (R) of 0.040 and weighted average of 19.2%, a difference of 5.1%.
Pakistani vs Cypriot Single Female Poverty

Single Female Poverty Correlation Summary

MeasurementPakistaniCypriot
Minimum7.7%2.9%
Maximum100.0%55.3%
Range92.3%52.4%
Mean31.6%18.9%
Median22.6%17.7%
Interquartile 25% (IQ1)18.4%13.0%
Interquartile 75% (IQ3)36.2%22.5%
Interquartile Range (IQR)17.8%9.5%
Standard Deviation (Sample)22.5%10.4%
Standard Deviation (Population)22.4%10.3%

Similar Demographics by Single Female Poverty

Demographics Similar to Pakistanis by Single Female Poverty

In terms of single female poverty, the demographic groups most similar to Pakistanis are Uruguayan (20.2%, a difference of 0.0%), Immigrants from England (20.2%, a difference of 0.030%), Immigrants from Hungary (20.2%, a difference of 0.050%), Immigrants from Morocco (20.2%, a difference of 0.080%), and Immigrants from Venezuela (20.2%, a difference of 0.12%).
DemographicsRating | RankSingle Female Poverty
Immigrants | Chile
94.3
/100
|
#124
Exceptional
20.1%
Immigrants | South Africa
93.9
/100
|
#125
Exceptional
20.1%
Serbians
93.3
/100
|
#126
Exceptional
20.1%
Mongolians
93.2
/100
|
#127
Exceptional
20.2%
Immigrants | Spain
92.7
/100
|
#128
Exceptional
20.2%
Immigrants | Morocco
92.4
/100
|
#129
Exceptional
20.2%
Immigrants | Hungary
92.3
/100
|
#130
Exceptional
20.2%
Pakistanis
92.1
/100
|
#131
Exceptional
20.2%
Uruguayans
92.1
/100
|
#132
Exceptional
20.2%
Immigrants | England
91.9
/100
|
#133
Exceptional
20.2%
Immigrants | Venezuela
91.5
/100
|
#134
Exceptional
20.2%
Immigrants | Iraq
91.2
/100
|
#135
Exceptional
20.2%
Immigrants | Canada
91.2
/100
|
#136
Exceptional
20.2%
Immigrants | Nepal
90.6
/100
|
#137
Exceptional
20.3%
Slovenes
90.5
/100
|
#138
Exceptional
20.3%

Demographics Similar to Cypriots by Single Female Poverty

In terms of single female poverty, the demographic groups most similar to Cypriots are Palestinian (19.2%, a difference of 0.020%), Immigrants from Northern Europe (19.2%, a difference of 0.030%), Immigrants from Europe (19.2%, a difference of 0.030%), Immigrants from Egypt (19.2%, a difference of 0.060%), and Laotian (19.3%, a difference of 0.10%).
DemographicsRating | RankSingle Female Poverty
Immigrants | Bulgaria
99.7
/100
|
#58
Exceptional
19.1%
Sri Lankans
99.6
/100
|
#59
Exceptional
19.2%
Russians
99.6
/100
|
#60
Exceptional
19.2%
Cambodians
99.6
/100
|
#61
Exceptional
19.2%
Lithuanians
99.6
/100
|
#62
Exceptional
19.2%
Immigrants | Northern Europe
99.6
/100
|
#63
Exceptional
19.2%
Immigrants | Europe
99.6
/100
|
#64
Exceptional
19.2%
Cypriots
99.6
/100
|
#65
Exceptional
19.2%
Palestinians
99.6
/100
|
#66
Exceptional
19.2%
Immigrants | Egypt
99.6
/100
|
#67
Exceptional
19.2%
Laotians
99.5
/100
|
#68
Exceptional
19.3%
Paraguayans
99.5
/100
|
#69
Exceptional
19.3%
Immigrants | Jordan
99.4
/100
|
#70
Exceptional
19.3%
Immigrants | South Eastern Asia
99.4
/100
|
#71
Exceptional
19.3%
Immigrants | Latvia
99.4
/100
|
#72
Exceptional
19.3%