Pakistani vs Sri Lankan Unemployment Among Women with Children Under 6 years
COMPARE
Pakistani
Sri Lankan
Unemployment Among Women with Children Under 6 years
Unemployment Among Women with Children Under 6 years Comparison
Pakistanis
Sri Lankans
7.3%
UNEMPLOYMENT AMONG WOMEN WITH CHILDREN UNDER 6 YEARS
92.2/ 100
METRIC RATING
125th/ 347
METRIC RANK
6.6%
UNEMPLOYMENT AMONG WOMEN WITH CHILDREN UNDER 6 YEARS
100.0/ 100
METRIC RATING
37th/ 347
METRIC RANK
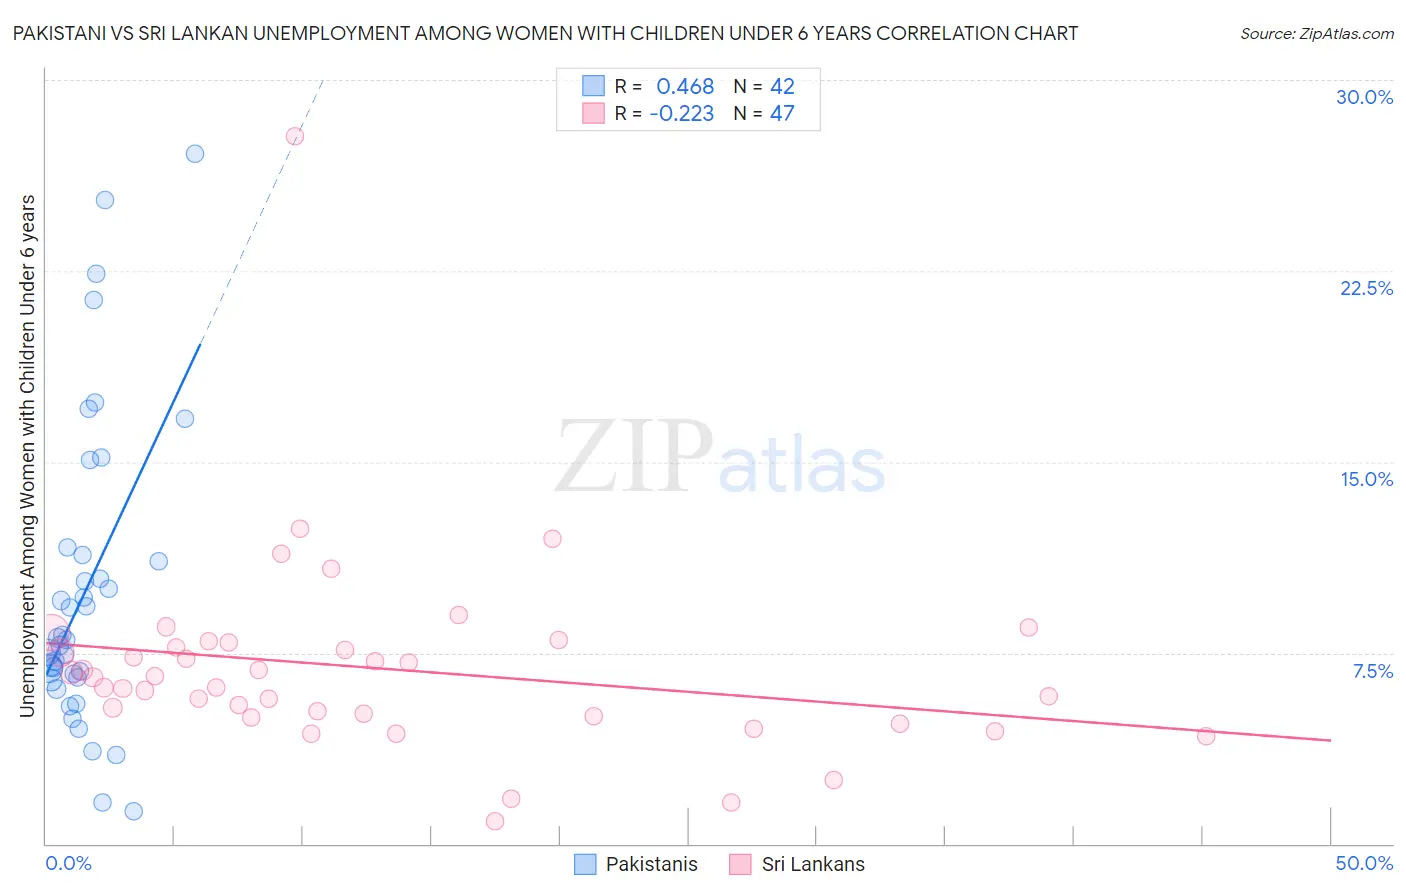
Pakistani vs Sri Lankan Unemployment Among Women with Children Under 6 years Correlation Chart
The statistical analysis conducted on geographies consisting of 266,898,941 people shows a moderate positive correlation between the proportion of Pakistanis and unemployment rate among women with children under the age of 6 in the United States with a correlation coefficient (R) of 0.468 and weighted average of 7.3%. Similarly, the statistical analysis conducted on geographies consisting of 330,167,868 people shows a weak negative correlation between the proportion of Sri Lankans and unemployment rate among women with children under the age of 6 in the United States with a correlation coefficient (R) of -0.223 and weighted average of 6.6%, a difference of 10.3%.
Unemployment Among Women with Children Under 6 years Correlation Summary
| Measurement | Pakistani | Sri Lankan |
| Minimum | 1.3% | 0.90% |
| Maximum | 27.1% | 27.8% |
| Range | 25.8% | 26.9% |
| Mean | 10.0% | 6.9% |
| Median | 8.0% | 6.5% |
| Interquartile 25% (IQ1) | 6.5% | 5.0% |
| Interquartile 75% (IQ3) | 11.3% | 7.9% |
| Interquartile Range (IQR) | 4.8% | 2.9% |
| Standard Deviation (Sample) | 6.0% | 3.9% |
| Standard Deviation (Population) | 5.9% | 3.9% |
Similar Demographics by Unemployment Among Women with Children Under 6 years
Demographics Similar to Pakistanis by Unemployment Among Women with Children Under 6 years
In terms of unemployment among women with children under 6 years, the demographic groups most similar to Pakistanis are Immigrants from Burma/Myanmar (7.3%, a difference of 0.070%), Immigrants from South Africa (7.3%, a difference of 0.080%), Jordanian (7.3%, a difference of 0.16%), Zimbabwean (7.3%, a difference of 0.17%), and Immigrants from Zaire (7.3%, a difference of 0.28%).
| Demographics | Rating | Rank | Unemployment Among Women with Children Under 6 years |
| Serbians | 94.5 /100 | #118 | Exceptional 7.3% |
| South Africans | 94.1 /100 | #119 | Exceptional 7.3% |
| Iraqis | 93.9 /100 | #120 | Exceptional 7.3% |
| Immigrants | Chile | 93.5 /100 | #121 | Exceptional 7.3% |
| Immigrants | Bosnia and Herzegovina | 93.5 /100 | #122 | Exceptional 7.3% |
| Immigrants | Zaire | 93.3 /100 | #123 | Exceptional 7.3% |
| Immigrants | South Africa | 92.5 /100 | #124 | Exceptional 7.3% |
| Pakistanis | 92.2 /100 | #125 | Exceptional 7.3% |
| Immigrants | Burma/Myanmar | 91.9 /100 | #126 | Exceptional 7.3% |
| Jordanians | 91.5 /100 | #127 | Exceptional 7.3% |
| Zimbabweans | 91.5 /100 | #128 | Exceptional 7.3% |
| Slovenes | 89.2 /100 | #129 | Excellent 7.4% |
| Swedes | 88.4 /100 | #130 | Excellent 7.4% |
| Ukrainians | 88.2 /100 | #131 | Excellent 7.4% |
| Immigrants | Armenia | 87.4 /100 | #132 | Excellent 7.4% |
Demographics Similar to Sri Lankans by Unemployment Among Women with Children Under 6 years
In terms of unemployment among women with children under 6 years, the demographic groups most similar to Sri Lankans are Hmong (6.7%, a difference of 0.13%), Immigrants from Russia (6.7%, a difference of 0.19%), Luxembourger (6.6%, a difference of 0.25%), Yakama (6.6%, a difference of 0.32%), and Asian (6.7%, a difference of 0.41%).
| Demographics | Rating | Rank | Unemployment Among Women with Children Under 6 years |
| Immigrants | Belarus | 100.0 /100 | #30 | Exceptional 6.6% |
| Immigrants | Moldova | 100.0 /100 | #31 | Exceptional 6.6% |
| Tsimshian | 100.0 /100 | #32 | Exceptional 6.6% |
| Immigrants | Vietnam | 100.0 /100 | #33 | Exceptional 6.6% |
| Immigrants | South Central Asia | 100.0 /100 | #34 | Exceptional 6.6% |
| Yakama | 100.0 /100 | #35 | Exceptional 6.6% |
| Luxembourgers | 100.0 /100 | #36 | Exceptional 6.6% |
| Sri Lankans | 100.0 /100 | #37 | Exceptional 6.6% |
| Hmong | 100.0 /100 | #38 | Exceptional 6.7% |
| Immigrants | Russia | 100.0 /100 | #39 | Exceptional 6.7% |
| Asians | 100.0 /100 | #40 | Exceptional 6.7% |
| Immigrants | Indonesia | 99.9 /100 | #41 | Exceptional 6.7% |
| Immigrants | Cuba | 99.9 /100 | #42 | Exceptional 6.7% |
| Bhutanese | 99.9 /100 | #43 | Exceptional 6.7% |
| Iranians | 99.9 /100 | #44 | Exceptional 6.7% |