Pakistani vs Immigrants from Pakistan Single Female Poverty
COMPARE
Pakistani
Immigrants from Pakistan
Single Female Poverty
Single Female Poverty Comparison
Pakistanis
Immigrants from Pakistan
20.2%
SINGLE FEMALE POVERTY
92.1/ 100
METRIC RATING
131st/ 347
METRIC RANK
18.4%
SINGLE FEMALE POVERTY
100.0/ 100
METRIC RATING
27th/ 347
METRIC RANK
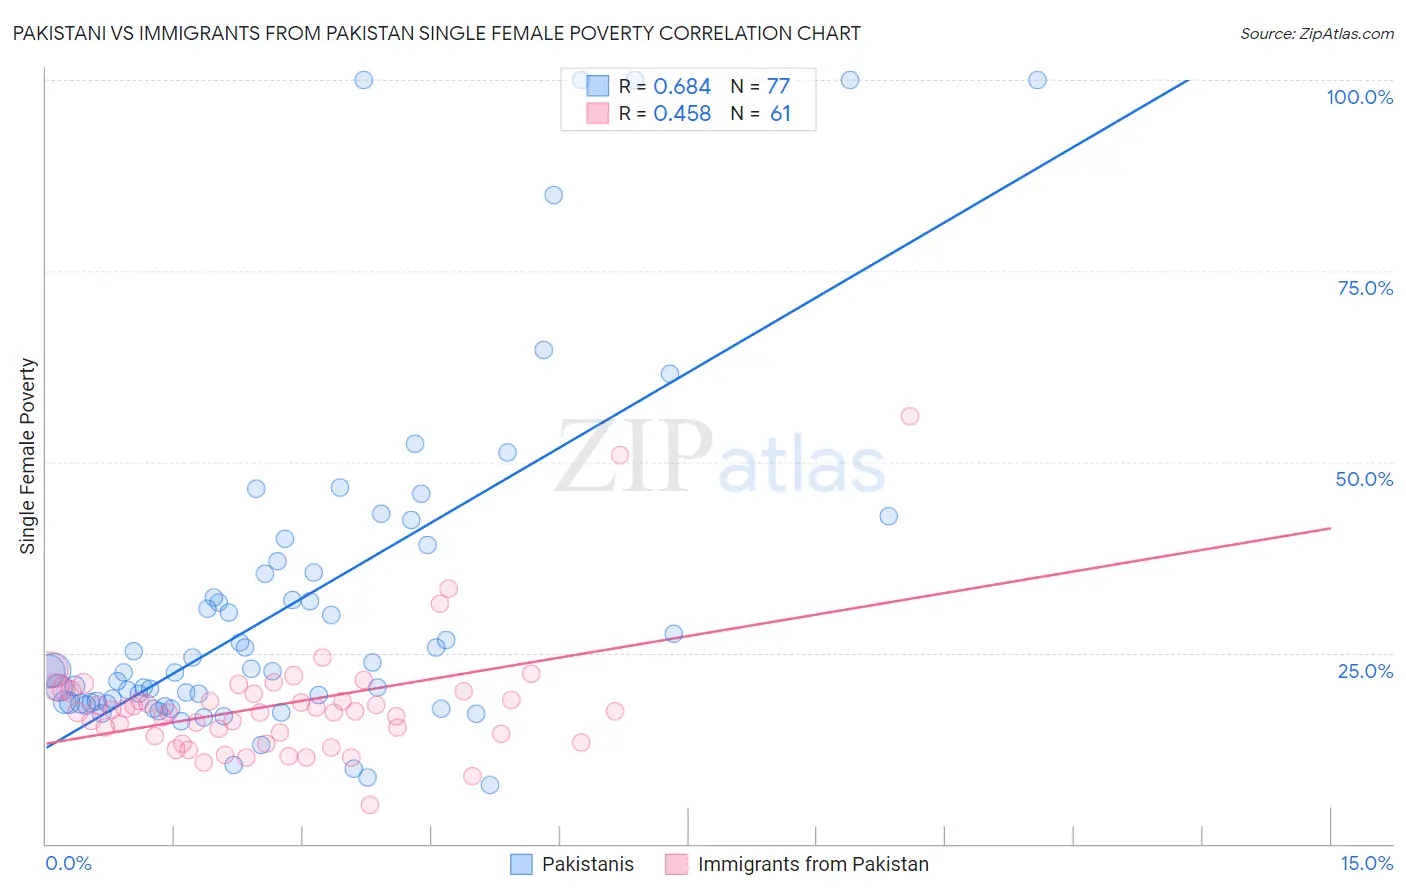
Pakistani vs Immigrants from Pakistan Single Female Poverty Correlation Chart
The statistical analysis conducted on geographies consisting of 331,803,446 people shows a significant positive correlation between the proportion of Pakistanis and poverty level among single females in the United States with a correlation coefficient (R) of 0.684 and weighted average of 20.2%. Similarly, the statistical analysis conducted on geographies consisting of 280,684,274 people shows a moderate positive correlation between the proportion of Immigrants from Pakistan and poverty level among single females in the United States with a correlation coefficient (R) of 0.458 and weighted average of 18.4%, a difference of 9.8%.
Single Female Poverty Correlation Summary
| Measurement | Pakistani | Immigrants from Pakistan |
| Minimum | 7.7% | 5.1% |
| Maximum | 100.0% | 55.9% |
| Range | 92.3% | 50.9% |
| Mean | 31.6% | 18.3% |
| Median | 22.6% | 17.3% |
| Interquartile 25% (IQ1) | 18.4% | 14.2% |
| Interquartile 75% (IQ3) | 36.2% | 20.0% |
| Interquartile Range (IQR) | 17.8% | 5.8% |
| Standard Deviation (Sample) | 22.5% | 8.0% |
| Standard Deviation (Population) | 22.4% | 8.0% |
Similar Demographics by Single Female Poverty
Demographics Similar to Pakistanis by Single Female Poverty
In terms of single female poverty, the demographic groups most similar to Pakistanis are Uruguayan (20.2%, a difference of 0.0%), Immigrants from England (20.2%, a difference of 0.030%), Immigrants from Hungary (20.2%, a difference of 0.050%), Immigrants from Morocco (20.2%, a difference of 0.080%), and Immigrants from Venezuela (20.2%, a difference of 0.12%).
| Demographics | Rating | Rank | Single Female Poverty |
| Immigrants | Chile | 94.3 /100 | #124 | Exceptional 20.1% |
| Immigrants | South Africa | 93.9 /100 | #125 | Exceptional 20.1% |
| Serbians | 93.3 /100 | #126 | Exceptional 20.1% |
| Mongolians | 93.2 /100 | #127 | Exceptional 20.2% |
| Immigrants | Spain | 92.7 /100 | #128 | Exceptional 20.2% |
| Immigrants | Morocco | 92.4 /100 | #129 | Exceptional 20.2% |
| Immigrants | Hungary | 92.3 /100 | #130 | Exceptional 20.2% |
| Pakistanis | 92.1 /100 | #131 | Exceptional 20.2% |
| Uruguayans | 92.1 /100 | #132 | Exceptional 20.2% |
| Immigrants | England | 91.9 /100 | #133 | Exceptional 20.2% |
| Immigrants | Venezuela | 91.5 /100 | #134 | Exceptional 20.2% |
| Immigrants | Iraq | 91.2 /100 | #135 | Exceptional 20.2% |
| Immigrants | Canada | 91.2 /100 | #136 | Exceptional 20.2% |
| Immigrants | Nepal | 90.6 /100 | #137 | Exceptional 20.3% |
| Slovenes | 90.5 /100 | #138 | Exceptional 20.3% |
Demographics Similar to Immigrants from Pakistan by Single Female Poverty
In terms of single female poverty, the demographic groups most similar to Immigrants from Pakistan are Immigrants from Israel (18.3%, a difference of 0.33%), Immigrants from Singapore (18.3%, a difference of 0.36%), Armenian (18.3%, a difference of 0.46%), Immigrants from Moldova (18.5%, a difference of 0.49%), and Immigrants from Poland (18.5%, a difference of 0.59%).
| Demographics | Rating | Rank | Single Female Poverty |
| Immigrants | Greece | 100.0 /100 | #20 | Exceptional 18.3% |
| Maltese | 100.0 /100 | #21 | Exceptional 18.3% |
| Burmese | 100.0 /100 | #22 | Exceptional 18.3% |
| Asians | 100.0 /100 | #23 | Exceptional 18.3% |
| Armenians | 100.0 /100 | #24 | Exceptional 18.3% |
| Immigrants | Singapore | 100.0 /100 | #25 | Exceptional 18.3% |
| Immigrants | Israel | 100.0 /100 | #26 | Exceptional 18.3% |
| Immigrants | Pakistan | 100.0 /100 | #27 | Exceptional 18.4% |
| Immigrants | Moldova | 100.0 /100 | #28 | Exceptional 18.5% |
| Immigrants | Poland | 100.0 /100 | #29 | Exceptional 18.5% |
| Immigrants | North Macedonia | 99.9 /100 | #30 | Exceptional 18.5% |
| Immigrants | Asia | 99.9 /100 | #31 | Exceptional 18.6% |
| Immigrants | Sri Lanka | 99.9 /100 | #32 | Exceptional 18.6% |
| Immigrants | Philippines | 99.9 /100 | #33 | Exceptional 18.6% |
| Koreans | 99.9 /100 | #34 | Exceptional 18.6% |