Ottawa vs Irish Single Female Poverty
COMPARE
Ottawa
Irish
Single Female Poverty
Single Female Poverty Comparison
Ottawa
Irish
26.0%
SINGLE FEMALE POVERTY
0.0/ 100
METRIC RATING
317th/ 347
METRIC RANK
21.4%
SINGLE FEMALE POVERTY
21.4/ 100
METRIC RATING
200th/ 347
METRIC RANK
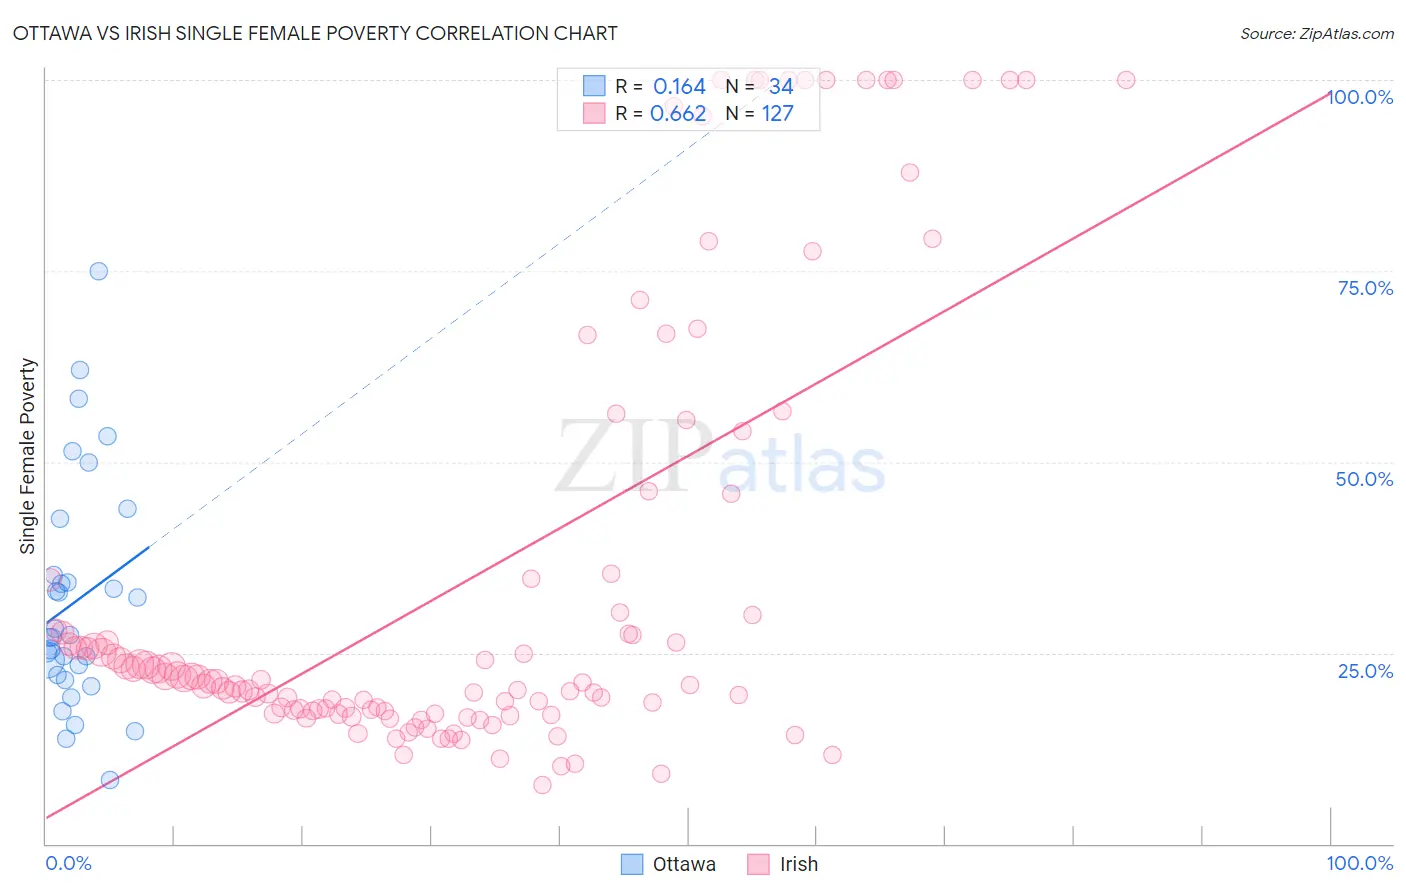
Ottawa vs Irish Single Female Poverty Correlation Chart
The statistical analysis conducted on geographies consisting of 49,782,789 people shows a poor positive correlation between the proportion of Ottawa and poverty level among single females in the United States with a correlation coefficient (R) of 0.164 and weighted average of 26.0%. Similarly, the statistical analysis conducted on geographies consisting of 557,675,928 people shows a significant positive correlation between the proportion of Irish and poverty level among single females in the United States with a correlation coefficient (R) of 0.662 and weighted average of 21.4%, a difference of 21.3%.
Single Female Poverty Correlation Summary
| Measurement | Ottawa | Irish |
| Minimum | 8.3% | 7.7% |
| Maximum | 75.0% | 100.0% |
| Range | 66.7% | 92.3% |
| Mean | 31.8% | 34.3% |
| Median | 27.2% | 21.2% |
| Interquartile 25% (IQ1) | 22.0% | 17.4% |
| Interquartile 75% (IQ3) | 35.2% | 34.5% |
| Interquartile Range (IQR) | 13.1% | 17.1% |
| Standard Deviation (Sample) | 15.1% | 28.5% |
| Standard Deviation (Population) | 14.8% | 28.4% |
Similar Demographics by Single Female Poverty
Demographics Similar to Ottawa by Single Female Poverty
In terms of single female poverty, the demographic groups most similar to Ottawa are Immigrants from Somalia (25.8%, a difference of 0.84%), Iroquois (25.7%, a difference of 1.0%), Chickasaw (26.3%, a difference of 1.0%), Cherokee (25.7%, a difference of 1.3%), and Black/African American (26.4%, a difference of 1.4%).
| Demographics | Rating | Rank | Single Female Poverty |
| Central American Indians | 0.0 /100 | #310 | Tragic 25.5% |
| Immigrants | Honduras | 0.0 /100 | #311 | Tragic 25.5% |
| Paiute | 0.0 /100 | #312 | Tragic 25.5% |
| Comanche | 0.0 /100 | #313 | Tragic 25.6% |
| Cherokee | 0.0 /100 | #314 | Tragic 25.7% |
| Iroquois | 0.0 /100 | #315 | Tragic 25.7% |
| Immigrants | Somalia | 0.0 /100 | #316 | Tragic 25.8% |
| Ottawa | 0.0 /100 | #317 | Tragic 26.0% |
| Chickasaw | 0.0 /100 | #318 | Tragic 26.3% |
| Blacks/African Americans | 0.0 /100 | #319 | Tragic 26.4% |
| Arapaho | 0.0 /100 | #320 | Tragic 26.4% |
| Yup'ik | 0.0 /100 | #321 | Tragic 26.6% |
| Seminole | 0.0 /100 | #322 | Tragic 26.8% |
| Chippewa | 0.0 /100 | #323 | Tragic 26.8% |
| Kiowa | 0.0 /100 | #324 | Tragic 26.9% |
Demographics Similar to Irish by Single Female Poverty
In terms of single female poverty, the demographic groups most similar to Irish are Nigerian (21.4%, a difference of 0.040%), Immigrants (21.4%, a difference of 0.050%), Immigrants from Kenya (21.4%, a difference of 0.070%), Swiss (21.4%, a difference of 0.25%), and Immigrants from Haiti (21.5%, a difference of 0.25%).
| Demographics | Rating | Rank | Single Female Poverty |
| Basques | 28.1 /100 | #193 | Fair 21.3% |
| Czechoslovakians | 27.7 /100 | #194 | Fair 21.3% |
| Nicaraguans | 27.6 /100 | #195 | Fair 21.3% |
| Immigrants | Saudi Arabia | 27.1 /100 | #196 | Fair 21.3% |
| Japanese | 26.4 /100 | #197 | Fair 21.3% |
| Swiss | 24.2 /100 | #198 | Fair 21.4% |
| Immigrants | Immigrants | 22.0 /100 | #199 | Fair 21.4% |
| Irish | 21.4 /100 | #200 | Fair 21.4% |
| Nigerians | 20.9 /100 | #201 | Fair 21.4% |
| Immigrants | Kenya | 20.7 /100 | #202 | Fair 21.4% |
| Immigrants | Haiti | 18.8 /100 | #203 | Poor 21.5% |
| Immigrants | Africa | 16.7 /100 | #204 | Poor 21.5% |
| Finns | 16.2 /100 | #205 | Poor 21.5% |
| Belgians | 16.1 /100 | #206 | Poor 21.5% |
| Ghanaians | 15.7 /100 | #207 | Poor 21.6% |