Ottawa vs Dutch Single Female Poverty
COMPARE
Ottawa
Dutch
Single Female Poverty
Single Female Poverty Comparison
Ottawa
Dutch
26.0%
SINGLE FEMALE POVERTY
0.0/ 100
METRIC RATING
317th/ 347
METRIC RANK
22.0%
SINGLE FEMALE POVERTY
4.6/ 100
METRIC RATING
235th/ 347
METRIC RANK
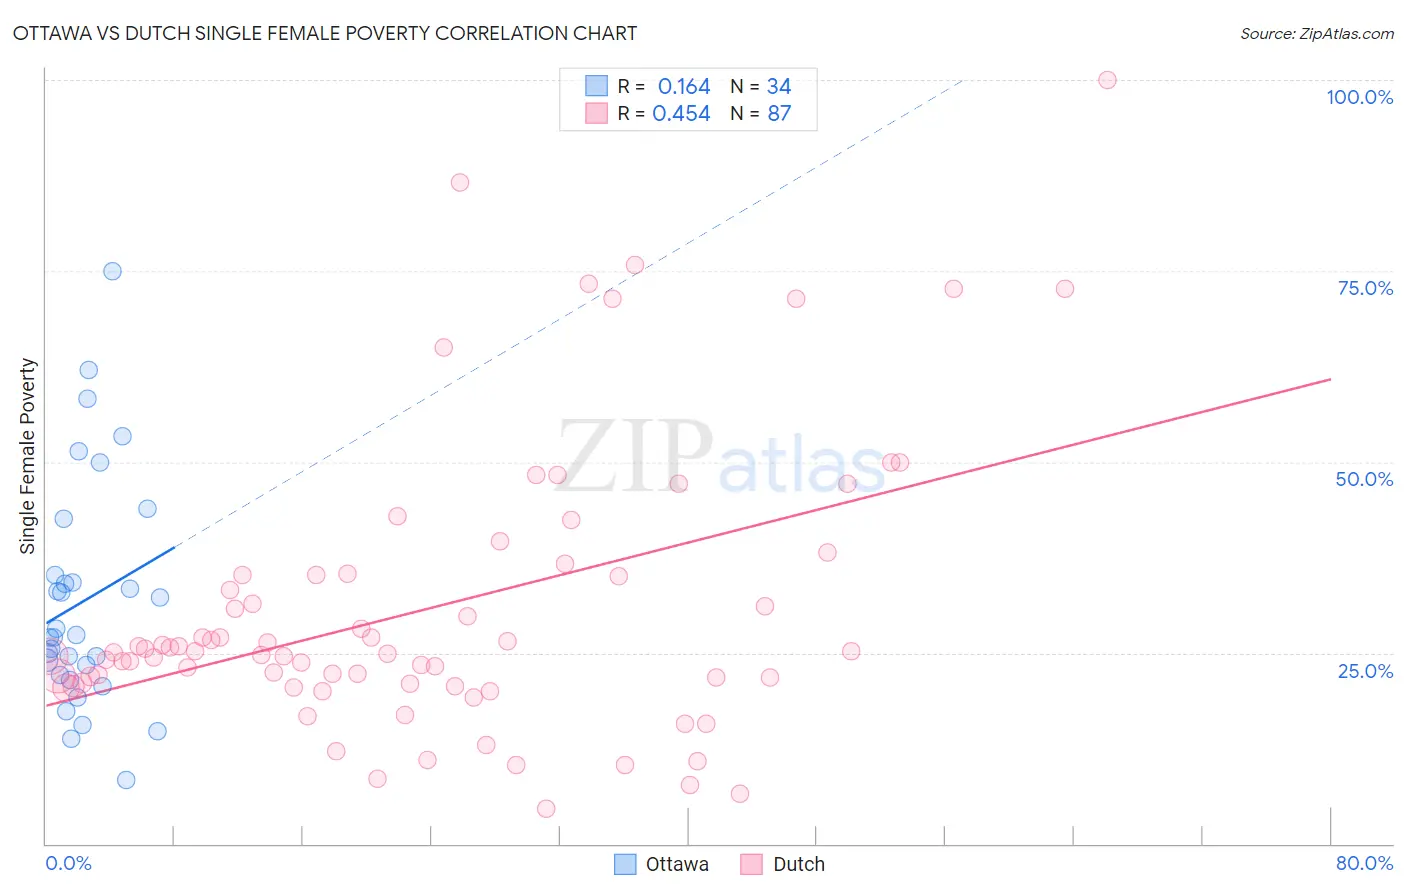
Ottawa vs Dutch Single Female Poverty Correlation Chart
The statistical analysis conducted on geographies consisting of 49,782,789 people shows a poor positive correlation between the proportion of Ottawa and poverty level among single females in the United States with a correlation coefficient (R) of 0.164 and weighted average of 26.0%. Similarly, the statistical analysis conducted on geographies consisting of 536,025,433 people shows a moderate positive correlation between the proportion of Dutch and poverty level among single females in the United States with a correlation coefficient (R) of 0.454 and weighted average of 22.0%, a difference of 18.2%.
Single Female Poverty Correlation Summary
| Measurement | Ottawa | Dutch |
| Minimum | 8.3% | 4.6% |
| Maximum | 75.0% | 100.0% |
| Range | 66.7% | 95.4% |
| Mean | 31.8% | 30.8% |
| Median | 27.2% | 25.0% |
| Interquartile 25% (IQ1) | 22.0% | 20.9% |
| Interquartile 75% (IQ3) | 35.2% | 35.2% |
| Interquartile Range (IQR) | 13.1% | 14.3% |
| Standard Deviation (Sample) | 15.1% | 18.7% |
| Standard Deviation (Population) | 14.8% | 18.6% |
Similar Demographics by Single Female Poverty
Demographics Similar to Ottawa by Single Female Poverty
In terms of single female poverty, the demographic groups most similar to Ottawa are Immigrants from Somalia (25.8%, a difference of 0.84%), Iroquois (25.7%, a difference of 1.0%), Chickasaw (26.3%, a difference of 1.0%), Cherokee (25.7%, a difference of 1.3%), and Black/African American (26.4%, a difference of 1.4%).
| Demographics | Rating | Rank | Single Female Poverty |
| Central American Indians | 0.0 /100 | #310 | Tragic 25.5% |
| Immigrants | Honduras | 0.0 /100 | #311 | Tragic 25.5% |
| Paiute | 0.0 /100 | #312 | Tragic 25.5% |
| Comanche | 0.0 /100 | #313 | Tragic 25.6% |
| Cherokee | 0.0 /100 | #314 | Tragic 25.7% |
| Iroquois | 0.0 /100 | #315 | Tragic 25.7% |
| Immigrants | Somalia | 0.0 /100 | #316 | Tragic 25.8% |
| Ottawa | 0.0 /100 | #317 | Tragic 26.0% |
| Chickasaw | 0.0 /100 | #318 | Tragic 26.3% |
| Blacks/African Americans | 0.0 /100 | #319 | Tragic 26.4% |
| Arapaho | 0.0 /100 | #320 | Tragic 26.4% |
| Yup'ik | 0.0 /100 | #321 | Tragic 26.6% |
| Seminole | 0.0 /100 | #322 | Tragic 26.8% |
| Chippewa | 0.0 /100 | #323 | Tragic 26.8% |
| Kiowa | 0.0 /100 | #324 | Tragic 26.9% |
Demographics Similar to Dutch by Single Female Poverty
In terms of single female poverty, the demographic groups most similar to Dutch are Spaniard (22.0%, a difference of 0.020%), Spanish (22.0%, a difference of 0.020%), Immigrants from Thailand (22.0%, a difference of 0.12%), Welsh (22.0%, a difference of 0.13%), and Immigrants from Ecuador (22.0%, a difference of 0.16%).
| Demographics | Rating | Rank | Single Female Poverty |
| Salvadorans | 5.5 /100 | #228 | Tragic 21.9% |
| Tlingit-Haida | 5.4 /100 | #229 | Tragic 21.9% |
| Immigrants | Western Africa | 5.3 /100 | #230 | Tragic 22.0% |
| Welsh | 5.0 /100 | #231 | Tragic 22.0% |
| Immigrants | Thailand | 5.0 /100 | #232 | Tragic 22.0% |
| Spaniards | 4.7 /100 | #233 | Tragic 22.0% |
| Spanish | 4.7 /100 | #234 | Tragic 22.0% |
| Dutch | 4.6 /100 | #235 | Tragic 22.0% |
| Immigrants | Ecuador | 4.2 /100 | #236 | Tragic 22.0% |
| Vietnamese | 4.0 /100 | #237 | Tragic 22.0% |
| French Canadians | 2.8 /100 | #238 | Tragic 22.2% |
| Malaysians | 2.8 /100 | #239 | Tragic 22.2% |
| French | 2.3 /100 | #240 | Tragic 22.2% |
| Cape Verdeans | 2.1 /100 | #241 | Tragic 22.3% |
| Bermudans | 2.0 /100 | #242 | Tragic 22.3% |