Ottawa vs Irish In Labor Force | Age 35-44
COMPARE
Ottawa
Irish
In Labor Force | Age 35-44
In Labor Force | Age 35-44 Comparison
Ottawa
Irish
82.6%
IN LABOR FORCE | AGE 35-44
0.0/ 100
METRIC RATING
298th/ 347
METRIC RANK
84.4%
IN LABOR FORCE | AGE 35-44
53.1/ 100
METRIC RATING
168th/ 347
METRIC RANK
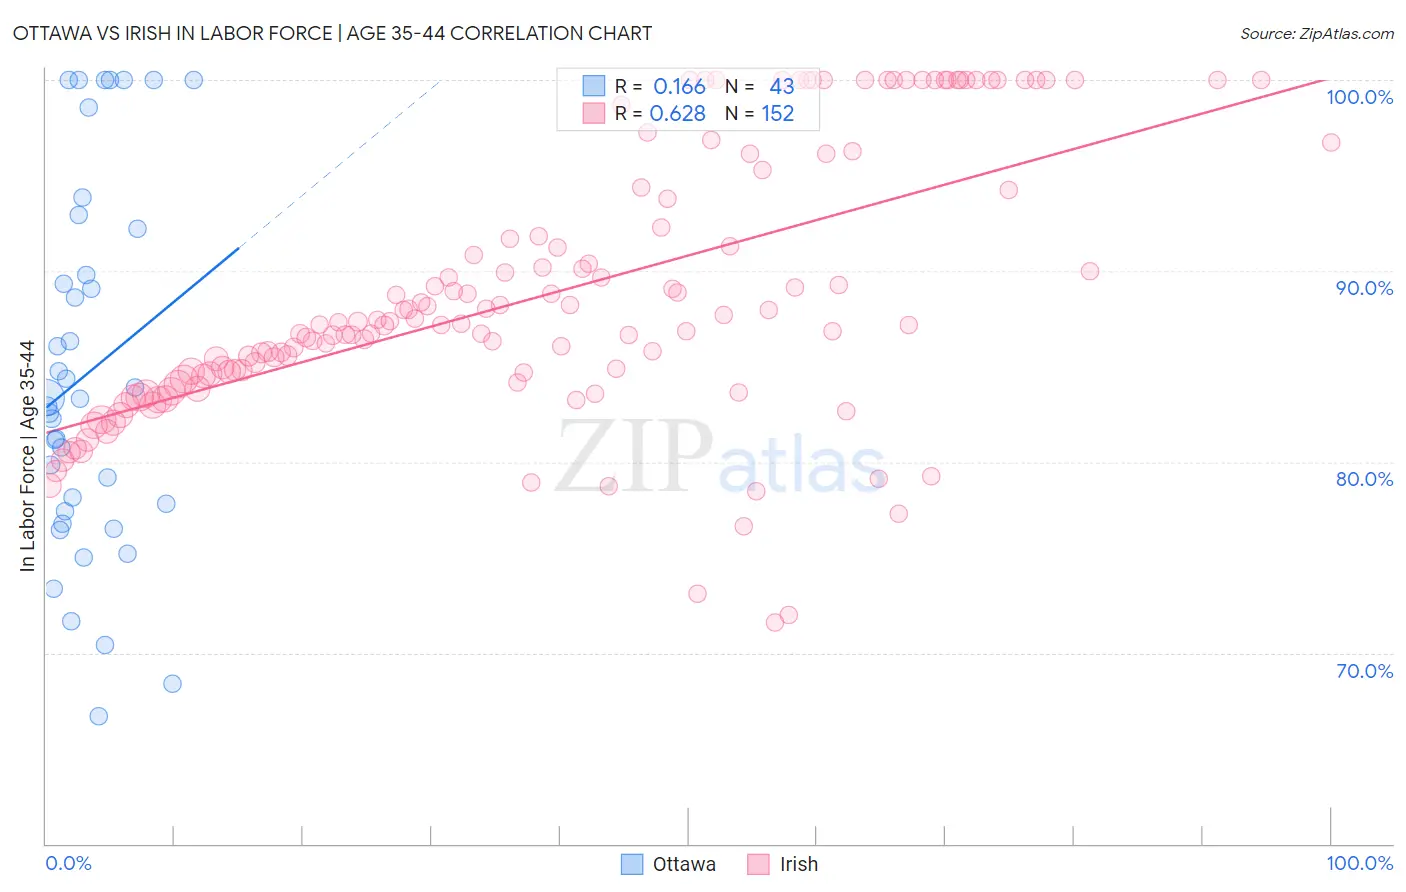
Ottawa vs Irish In Labor Force | Age 35-44 Correlation Chart
The statistical analysis conducted on geographies consisting of 49,950,273 people shows a poor positive correlation between the proportion of Ottawa and labor force participation rate among population between the ages 35 and 44 in the United States with a correlation coefficient (R) of 0.166 and weighted average of 82.6%. Similarly, the statistical analysis conducted on geographies consisting of 579,649,730 people shows a significant positive correlation between the proportion of Irish and labor force participation rate among population between the ages 35 and 44 in the United States with a correlation coefficient (R) of 0.628 and weighted average of 84.4%, a difference of 2.2%.
In Labor Force | Age 35-44 Correlation Summary
| Measurement | Ottawa | Irish |
| Minimum | 66.7% | 71.6% |
| Maximum | 100.0% | 100.0% |
| Range | 33.3% | 28.4% |
| Mean | 84.6% | 88.8% |
| Median | 83.3% | 87.2% |
| Interquartile 25% (IQ1) | 77.4% | 84.4% |
| Interquartile 75% (IQ3) | 92.2% | 94.0% |
| Interquartile Range (IQR) | 14.8% | 9.6% |
| Standard Deviation (Sample) | 9.6% | 7.0% |
| Standard Deviation (Population) | 9.5% | 6.9% |
Similar Demographics by In Labor Force | Age 35-44
Demographics Similar to Ottawa by In Labor Force | Age 35-44
In terms of in labor force | age 35-44, the demographic groups most similar to Ottawa are Tlingit-Haida (82.5%, a difference of 0.010%), Mexican American Indian (82.6%, a difference of 0.020%), Hmong (82.6%, a difference of 0.020%), Central American Indian (82.5%, a difference of 0.080%), and Spanish American Indian (82.5%, a difference of 0.10%).
| Demographics | Rating | Rank | In Labor Force | Age 35-44 |
| Pennsylvania Germans | 0.0 /100 | #291 | Tragic 82.9% |
| Immigrants | Latin America | 0.0 /100 | #292 | Tragic 82.8% |
| Spanish Americans | 0.0 /100 | #293 | Tragic 82.8% |
| Potawatomi | 0.0 /100 | #294 | Tragic 82.7% |
| Immigrants | Lebanon | 0.0 /100 | #295 | Tragic 82.7% |
| Mexican American Indians | 0.0 /100 | #296 | Tragic 82.6% |
| Hmong | 0.0 /100 | #297 | Tragic 82.6% |
| Ottawa | 0.0 /100 | #298 | Tragic 82.6% |
| Tlingit-Haida | 0.0 /100 | #299 | Tragic 82.5% |
| Central American Indians | 0.0 /100 | #300 | Tragic 82.5% |
| Spanish American Indians | 0.0 /100 | #301 | Tragic 82.5% |
| Americans | 0.0 /100 | #302 | Tragic 82.4% |
| Nepalese | 0.0 /100 | #303 | Tragic 82.4% |
| Marshallese | 0.0 /100 | #304 | Tragic 82.4% |
| Shoshone | 0.0 /100 | #305 | Tragic 82.2% |
Demographics Similar to Irish by In Labor Force | Age 35-44
In terms of in labor force | age 35-44, the demographic groups most similar to Irish are Immigrants from Afghanistan (84.4%, a difference of 0.0%), Immigrants from Jordan (84.4%, a difference of 0.0%), Alsatian (84.4%, a difference of 0.010%), Immigrants from Portugal (84.4%, a difference of 0.010%), and Jordanian (84.4%, a difference of 0.010%).
| Demographics | Rating | Rank | In Labor Force | Age 35-44 |
| Immigrants | Venezuela | 60.0 /100 | #161 | Good 84.4% |
| Immigrants | Hungary | 59.4 /100 | #162 | Average 84.4% |
| Aleuts | 59.1 /100 | #163 | Average 84.4% |
| Nigerians | 58.9 /100 | #164 | Average 84.4% |
| Venezuelans | 58.1 /100 | #165 | Average 84.4% |
| Alsatians | 55.2 /100 | #166 | Average 84.4% |
| Immigrants | Portugal | 55.2 /100 | #167 | Average 84.4% |
| Irish | 53.1 /100 | #168 | Average 84.4% |
| Immigrants | Afghanistan | 52.7 /100 | #169 | Average 84.4% |
| Immigrants | Jordan | 52.5 /100 | #170 | Average 84.4% |
| Jordanians | 51.7 /100 | #171 | Average 84.4% |
| Scandinavians | 51.2 /100 | #172 | Average 84.4% |
| Immigrants | Trinidad and Tobago | 50.7 /100 | #173 | Average 84.4% |
| Immigrants | Iran | 50.0 /100 | #174 | Average 84.4% |
| Pakistanis | 48.2 /100 | #175 | Average 84.4% |