Immigrants from Philippines vs Irish Single Female Poverty
COMPARE
Immigrants from Philippines
Irish
Single Female Poverty
Single Female Poverty Comparison
Immigrants from Philippines
Irish
18.6%
SINGLE FEMALE POVERTY
99.9/ 100
METRIC RATING
33rd/ 347
METRIC RANK
21.4%
SINGLE FEMALE POVERTY
21.4/ 100
METRIC RATING
200th/ 347
METRIC RANK
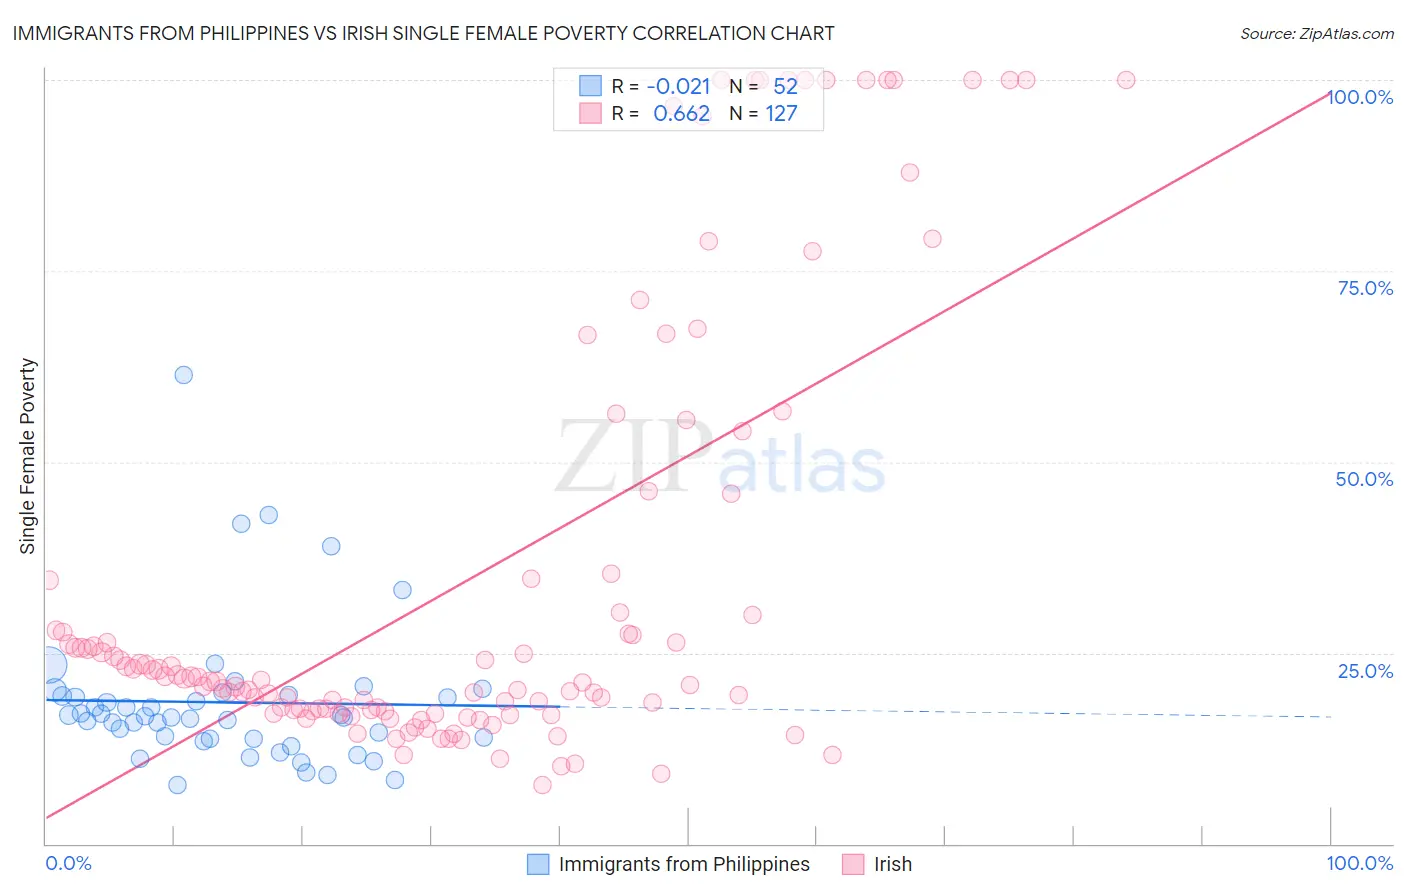
Immigrants from Philippines vs Irish Single Female Poverty Correlation Chart
The statistical analysis conducted on geographies consisting of 462,433,577 people shows no correlation between the proportion of Immigrants from Philippines and poverty level among single females in the United States with a correlation coefficient (R) of -0.021 and weighted average of 18.6%. Similarly, the statistical analysis conducted on geographies consisting of 557,675,928 people shows a significant positive correlation between the proportion of Irish and poverty level among single females in the United States with a correlation coefficient (R) of 0.662 and weighted average of 21.4%, a difference of 15.4%.
Single Female Poverty Correlation Summary
| Measurement | Immigrants from Philippines | Irish |
| Minimum | 7.7% | 7.7% |
| Maximum | 61.4% | 100.0% |
| Range | 53.7% | 92.3% |
| Mean | 18.5% | 34.3% |
| Median | 16.6% | 21.2% |
| Interquartile 25% (IQ1) | 13.8% | 17.4% |
| Interquartile 75% (IQ3) | 19.4% | 34.5% |
| Interquartile Range (IQR) | 5.6% | 17.1% |
| Standard Deviation (Sample) | 9.5% | 28.5% |
| Standard Deviation (Population) | 9.4% | 28.4% |
Similar Demographics by Single Female Poverty
Demographics Similar to Immigrants from Philippines by Single Female Poverty
In terms of single female poverty, the demographic groups most similar to Immigrants from Philippines are Immigrants from Sri Lanka (18.6%, a difference of 0.060%), Immigrants from Asia (18.6%, a difference of 0.15%), Korean (18.6%, a difference of 0.18%), Immigrants from North Macedonia (18.5%, a difference of 0.20%), and Immigrants from Japan (18.6%, a difference of 0.24%).
| Demographics | Rating | Rank | Single Female Poverty |
| Immigrants | Israel | 100.0 /100 | #26 | Exceptional 18.3% |
| Immigrants | Pakistan | 100.0 /100 | #27 | Exceptional 18.4% |
| Immigrants | Moldova | 100.0 /100 | #28 | Exceptional 18.5% |
| Immigrants | Poland | 100.0 /100 | #29 | Exceptional 18.5% |
| Immigrants | North Macedonia | 99.9 /100 | #30 | Exceptional 18.5% |
| Immigrants | Asia | 99.9 /100 | #31 | Exceptional 18.6% |
| Immigrants | Sri Lanka | 99.9 /100 | #32 | Exceptional 18.6% |
| Immigrants | Philippines | 99.9 /100 | #33 | Exceptional 18.6% |
| Koreans | 99.9 /100 | #34 | Exceptional 18.6% |
| Immigrants | Japan | 99.9 /100 | #35 | Exceptional 18.6% |
| Turks | 99.9 /100 | #36 | Exceptional 18.7% |
| Immigrants | Armenia | 99.9 /100 | #37 | Exceptional 18.7% |
| Tongans | 99.9 /100 | #38 | Exceptional 18.8% |
| Bulgarians | 99.9 /100 | #39 | Exceptional 18.8% |
| Okinawans | 99.9 /100 | #40 | Exceptional 18.8% |
Demographics Similar to Irish by Single Female Poverty
In terms of single female poverty, the demographic groups most similar to Irish are Nigerian (21.4%, a difference of 0.040%), Immigrants (21.4%, a difference of 0.050%), Immigrants from Kenya (21.4%, a difference of 0.070%), Swiss (21.4%, a difference of 0.25%), and Immigrants from Haiti (21.5%, a difference of 0.25%).
| Demographics | Rating | Rank | Single Female Poverty |
| Basques | 28.1 /100 | #193 | Fair 21.3% |
| Czechoslovakians | 27.7 /100 | #194 | Fair 21.3% |
| Nicaraguans | 27.6 /100 | #195 | Fair 21.3% |
| Immigrants | Saudi Arabia | 27.1 /100 | #196 | Fair 21.3% |
| Japanese | 26.4 /100 | #197 | Fair 21.3% |
| Swiss | 24.2 /100 | #198 | Fair 21.4% |
| Immigrants | Immigrants | 22.0 /100 | #199 | Fair 21.4% |
| Irish | 21.4 /100 | #200 | Fair 21.4% |
| Nigerians | 20.9 /100 | #201 | Fair 21.4% |
| Immigrants | Kenya | 20.7 /100 | #202 | Fair 21.4% |
| Immigrants | Haiti | 18.8 /100 | #203 | Poor 21.5% |
| Immigrants | Africa | 16.7 /100 | #204 | Poor 21.5% |
| Finns | 16.2 /100 | #205 | Poor 21.5% |
| Belgians | 16.1 /100 | #206 | Poor 21.5% |
| Ghanaians | 15.7 /100 | #207 | Poor 21.6% |