Austrian vs Irish Single Female Poverty
COMPARE
Austrian
Irish
Single Female Poverty
Single Female Poverty Comparison
Austrians
Irish
20.4%
SINGLE FEMALE POVERTY
85.8/ 100
METRIC RATING
145th/ 347
METRIC RANK
21.4%
SINGLE FEMALE POVERTY
21.4/ 100
METRIC RATING
200th/ 347
METRIC RANK
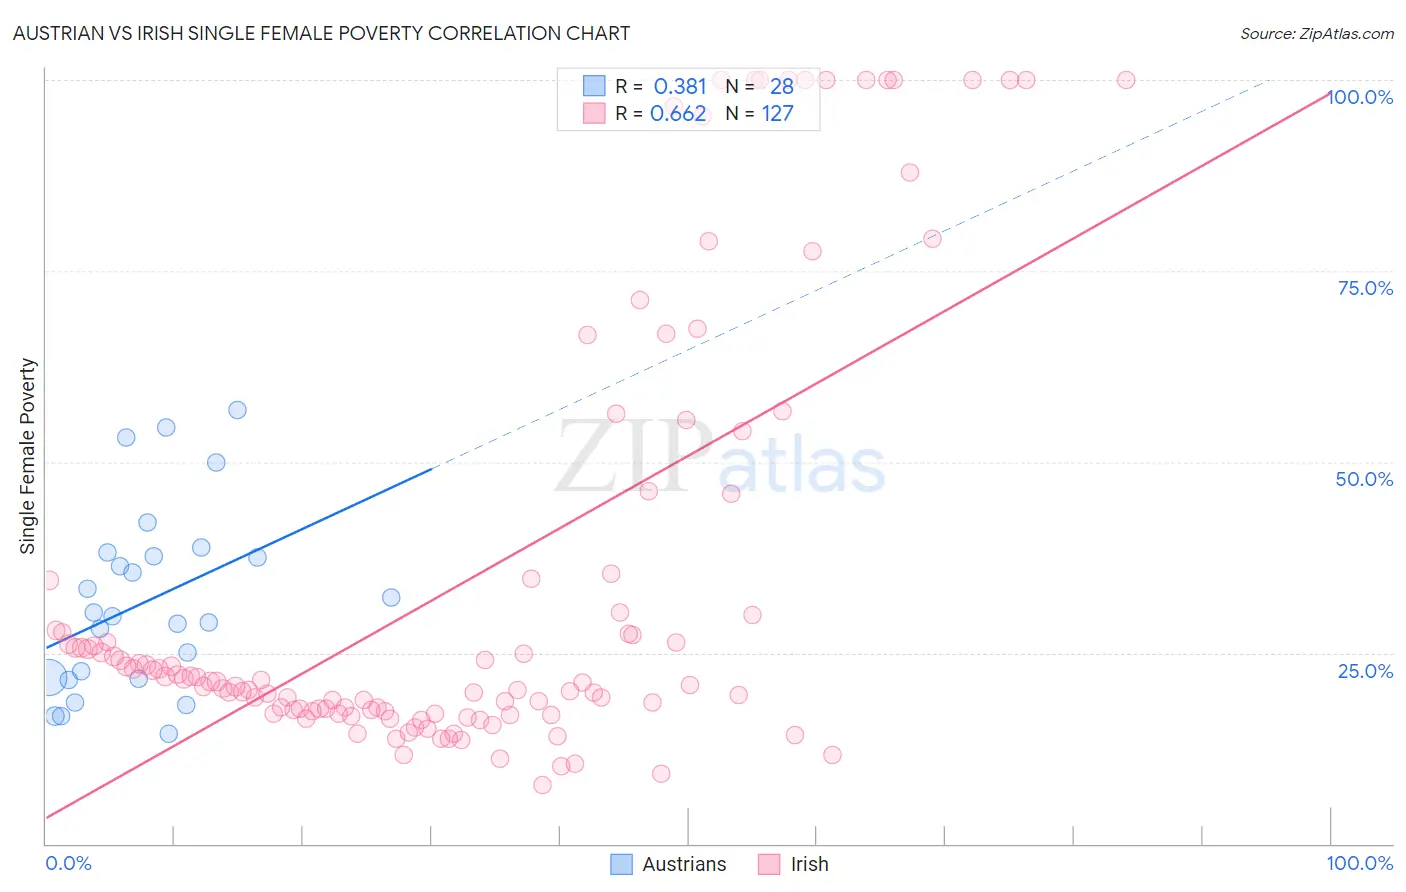
Austrian vs Irish Single Female Poverty Correlation Chart
The statistical analysis conducted on geographies consisting of 441,015,533 people shows a mild positive correlation between the proportion of Austrians and poverty level among single females in the United States with a correlation coefficient (R) of 0.381 and weighted average of 20.4%. Similarly, the statistical analysis conducted on geographies consisting of 557,675,928 people shows a significant positive correlation between the proportion of Irish and poverty level among single females in the United States with a correlation coefficient (R) of 0.662 and weighted average of 21.4%, a difference of 5.0%.
Single Female Poverty Correlation Summary
| Measurement | Austrian | Irish |
| Minimum | 14.3% | 7.7% |
| Maximum | 56.8% | 100.0% |
| Range | 42.4% | 92.3% |
| Mean | 31.8% | 34.3% |
| Median | 30.1% | 21.2% |
| Interquartile 25% (IQ1) | 21.7% | 17.4% |
| Interquartile 75% (IQ3) | 37.9% | 34.5% |
| Interquartile Range (IQR) | 16.2% | 17.1% |
| Standard Deviation (Sample) | 11.9% | 28.5% |
| Standard Deviation (Population) | 11.7% | 28.4% |
Similar Demographics by Single Female Poverty
Demographics Similar to Austrians by Single Female Poverty
In terms of single female poverty, the demographic groups most similar to Austrians are Venezuelan (20.4%, a difference of 0.030%), South African (20.4%, a difference of 0.060%), Luxembourger (20.4%, a difference of 0.11%), Immigrants from Uzbekistan (20.3%, a difference of 0.36%), and Australian (20.3%, a difference of 0.37%).
| Demographics | Rating | Rank | Single Female Poverty |
| Slovenes | 90.5 /100 | #138 | Exceptional 20.3% |
| Immigrants | Kuwait | 90.4 /100 | #139 | Exceptional 20.3% |
| Syrians | 90.4 /100 | #140 | Exceptional 20.3% |
| Immigrants | North America | 89.5 /100 | #141 | Excellent 20.3% |
| Immigrants | Uganda | 89.1 /100 | #142 | Excellent 20.3% |
| Australians | 88.4 /100 | #143 | Excellent 20.3% |
| Immigrants | Uzbekistan | 88.3 /100 | #144 | Excellent 20.3% |
| Austrians | 85.8 /100 | #145 | Excellent 20.4% |
| Venezuelans | 85.5 /100 | #146 | Excellent 20.4% |
| South Africans | 85.3 /100 | #147 | Excellent 20.4% |
| Luxembourgers | 84.9 /100 | #148 | Excellent 20.4% |
| Portuguese | 81.5 /100 | #149 | Excellent 20.5% |
| Immigrants | Denmark | 80.5 /100 | #150 | Excellent 20.5% |
| Puget Sound Salish | 79.6 /100 | #151 | Good 20.6% |
| Immigrants | Uruguay | 77.7 /100 | #152 | Good 20.6% |
Demographics Similar to Irish by Single Female Poverty
In terms of single female poverty, the demographic groups most similar to Irish are Nigerian (21.4%, a difference of 0.040%), Immigrants (21.4%, a difference of 0.050%), Immigrants from Kenya (21.4%, a difference of 0.070%), Swiss (21.4%, a difference of 0.25%), and Immigrants from Haiti (21.5%, a difference of 0.25%).
| Demographics | Rating | Rank | Single Female Poverty |
| Basques | 28.1 /100 | #193 | Fair 21.3% |
| Czechoslovakians | 27.7 /100 | #194 | Fair 21.3% |
| Nicaraguans | 27.6 /100 | #195 | Fair 21.3% |
| Immigrants | Saudi Arabia | 27.1 /100 | #196 | Fair 21.3% |
| Japanese | 26.4 /100 | #197 | Fair 21.3% |
| Swiss | 24.2 /100 | #198 | Fair 21.4% |
| Immigrants | Immigrants | 22.0 /100 | #199 | Fair 21.4% |
| Irish | 21.4 /100 | #200 | Fair 21.4% |
| Nigerians | 20.9 /100 | #201 | Fair 21.4% |
| Immigrants | Kenya | 20.7 /100 | #202 | Fair 21.4% |
| Immigrants | Haiti | 18.8 /100 | #203 | Poor 21.5% |
| Immigrants | Africa | 16.7 /100 | #204 | Poor 21.5% |
| Finns | 16.2 /100 | #205 | Poor 21.5% |
| Belgians | 16.1 /100 | #206 | Poor 21.5% |
| Ghanaians | 15.7 /100 | #207 | Poor 21.6% |