Immigrants from Cambodia vs Irish Single Female Poverty
COMPARE
Immigrants from Cambodia
Irish
Single Female Poverty
Single Female Poverty Comparison
Immigrants from Cambodia
Irish
21.2%
SINGLE FEMALE POVERTY
38.2/ 100
METRIC RATING
185th/ 347
METRIC RANK
21.4%
SINGLE FEMALE POVERTY
21.4/ 100
METRIC RATING
200th/ 347
METRIC RANK
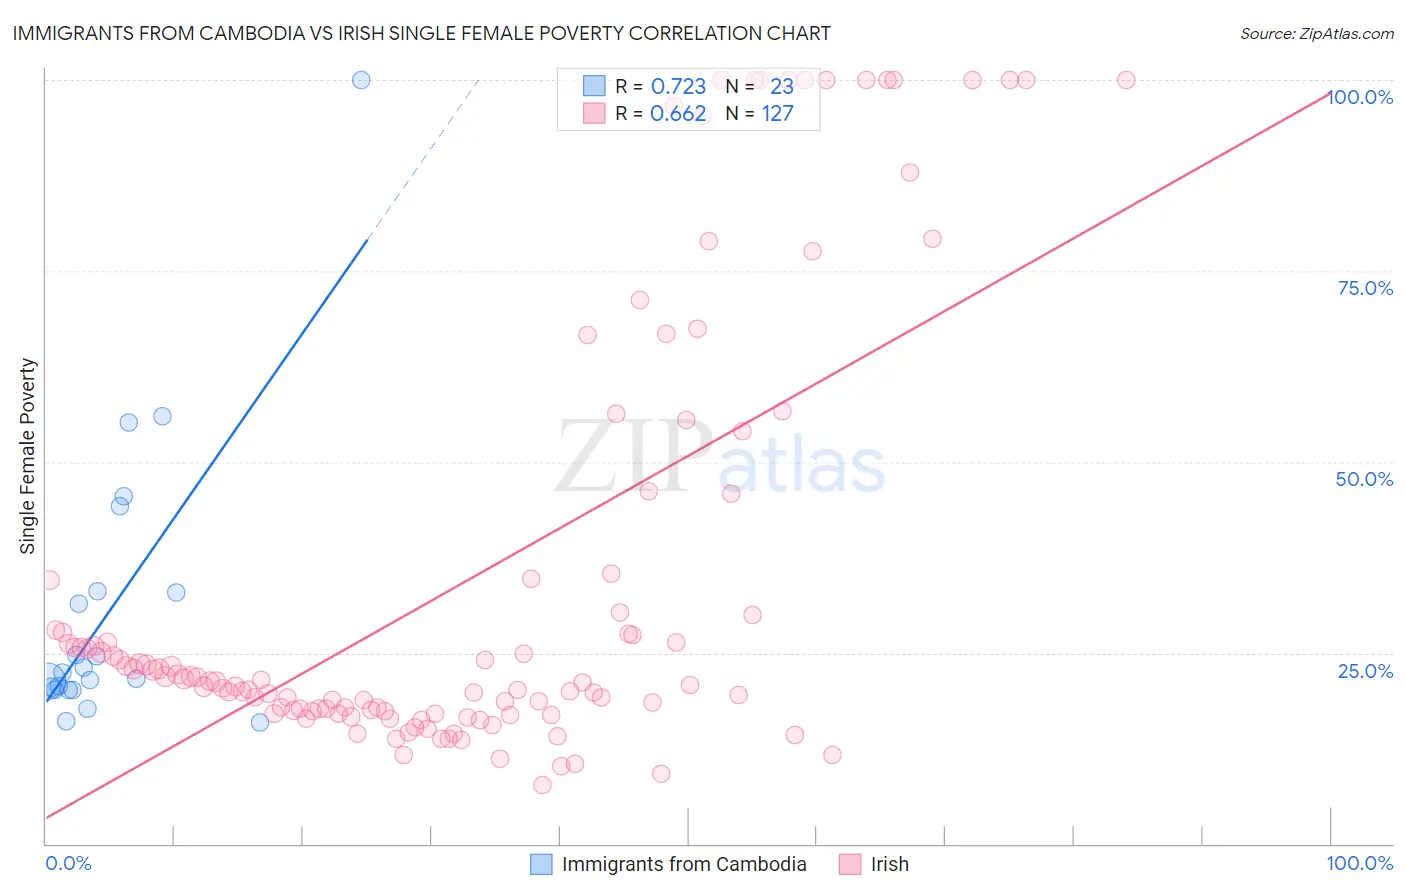
Immigrants from Cambodia vs Irish Single Female Poverty Correlation Chart
The statistical analysis conducted on geographies consisting of 204,042,246 people shows a strong positive correlation between the proportion of Immigrants from Cambodia and poverty level among single females in the United States with a correlation coefficient (R) of 0.723 and weighted average of 21.2%. Similarly, the statistical analysis conducted on geographies consisting of 557,675,928 people shows a significant positive correlation between the proportion of Irish and poverty level among single females in the United States with a correlation coefficient (R) of 0.662 and weighted average of 21.4%, a difference of 1.3%.
Single Female Poverty Correlation Summary
| Measurement | Immigrants from Cambodia | Irish |
| Minimum | 15.9% | 7.7% |
| Maximum | 100.0% | 100.0% |
| Range | 84.1% | 92.3% |
| Mean | 30.8% | 34.3% |
| Median | 22.4% | 21.2% |
| Interquartile 25% (IQ1) | 20.2% | 17.4% |
| Interquartile 75% (IQ3) | 33.1% | 34.5% |
| Interquartile Range (IQR) | 12.9% | 17.1% |
| Standard Deviation (Sample) | 19.1% | 28.5% |
| Standard Deviation (Population) | 18.7% | 28.4% |
Demographics Similar to Immigrants from Cambodia and Irish by Single Female Poverty
In terms of single female poverty, the demographic groups most similar to Immigrants from Cambodia are Hawaiian (21.2%, a difference of 0.040%), Hungarian (21.1%, a difference of 0.090%), Slovak (21.1%, a difference of 0.10%), Immigrants from Nigeria (21.2%, a difference of 0.10%), and Slavic (21.1%, a difference of 0.15%). Similarly, the demographic groups most similar to Irish are Nigerian (21.4%, a difference of 0.040%), Immigrants (21.4%, a difference of 0.050%), Immigrants from Kenya (21.4%, a difference of 0.070%), Swiss (21.4%, a difference of 0.25%), and Japanese (21.3%, a difference of 0.42%).
| Demographics | Rating | Rank | Single Female Poverty |
| Slavs | 40.5 /100 | #182 | Average 21.1% |
| Slovaks | 39.7 /100 | #183 | Fair 21.1% |
| Hungarians | 39.6 /100 | #184 | Fair 21.1% |
| Immigrants | Cambodia | 38.2 /100 | #185 | Fair 21.2% |
| Hawaiians | 37.7 /100 | #186 | Fair 21.2% |
| Immigrants | Nigeria | 36.8 /100 | #187 | Fair 21.2% |
| Yugoslavians | 35.4 /100 | #188 | Fair 21.2% |
| Immigrants | Cuba | 35.3 /100 | #189 | Fair 21.2% |
| Trinidadians and Tobagonians | 35.2 /100 | #190 | Fair 21.2% |
| Immigrants | Germany | 31.1 /100 | #191 | Fair 21.3% |
| Immigrants | Jamaica | 30.5 /100 | #192 | Fair 21.3% |
| Basques | 28.1 /100 | #193 | Fair 21.3% |
| Czechoslovakians | 27.7 /100 | #194 | Fair 21.3% |
| Nicaraguans | 27.6 /100 | #195 | Fair 21.3% |
| Immigrants | Saudi Arabia | 27.1 /100 | #196 | Fair 21.3% |
| Japanese | 26.4 /100 | #197 | Fair 21.3% |
| Swiss | 24.2 /100 | #198 | Fair 21.4% |
| Immigrants | Immigrants | 22.0 /100 | #199 | Fair 21.4% |
| Irish | 21.4 /100 | #200 | Fair 21.4% |
| Nigerians | 20.9 /100 | #201 | Fair 21.4% |
| Immigrants | Kenya | 20.7 /100 | #202 | Fair 21.4% |