Blackfeet vs Irish Single Female Poverty
COMPARE
Blackfeet
Irish
Single Female Poverty
Single Female Poverty Comparison
Blackfeet
Irish
25.1%
SINGLE FEMALE POVERTY
0.0/ 100
METRIC RATING
300th/ 347
METRIC RANK
21.4%
SINGLE FEMALE POVERTY
21.4/ 100
METRIC RATING
200th/ 347
METRIC RANK
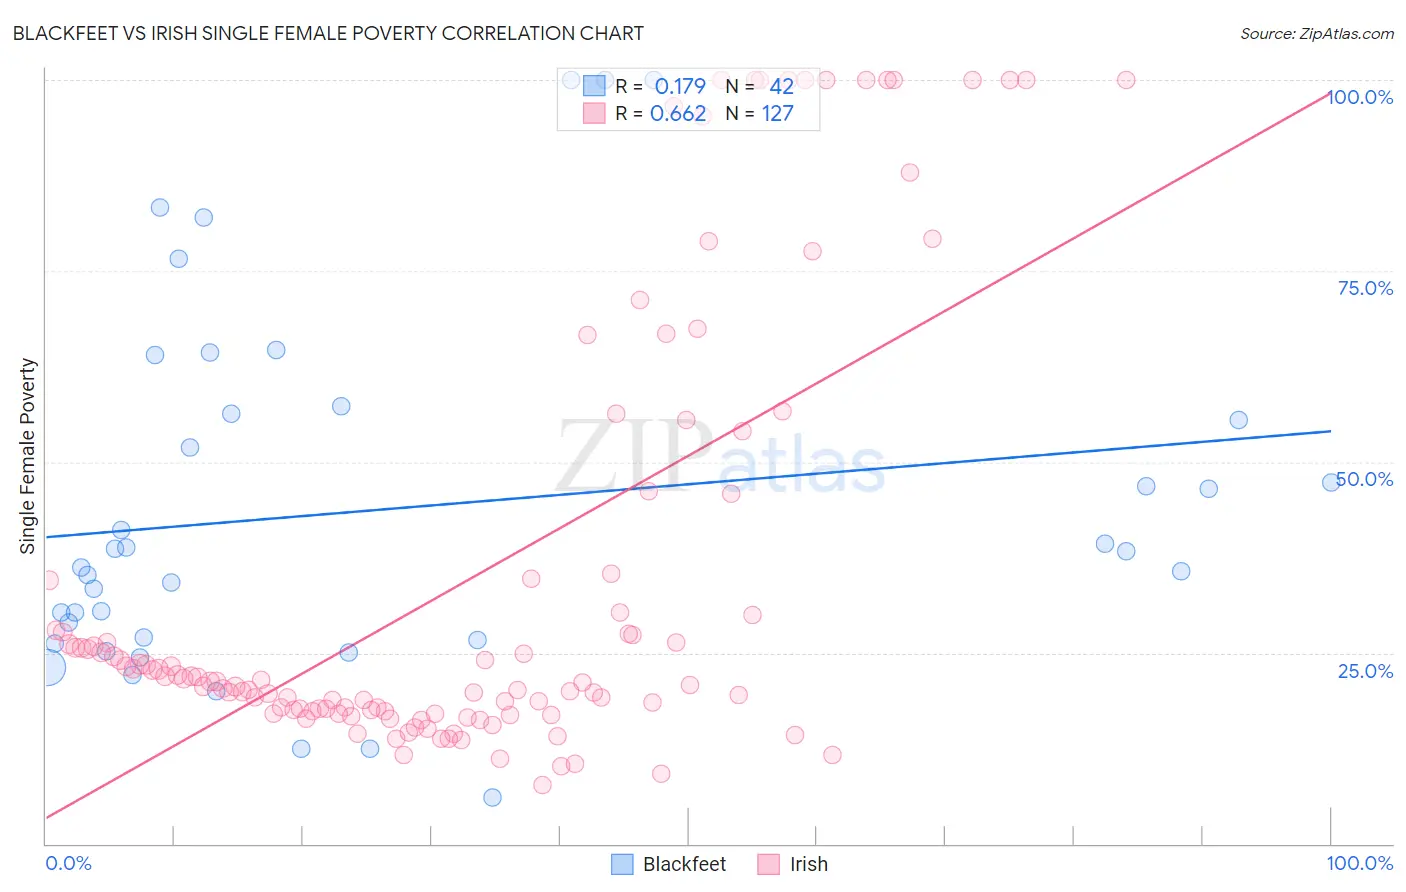
Blackfeet vs Irish Single Female Poverty Correlation Chart
The statistical analysis conducted on geographies consisting of 307,344,342 people shows a poor positive correlation between the proportion of Blackfeet and poverty level among single females in the United States with a correlation coefficient (R) of 0.179 and weighted average of 25.1%. Similarly, the statistical analysis conducted on geographies consisting of 557,675,928 people shows a significant positive correlation between the proportion of Irish and poverty level among single females in the United States with a correlation coefficient (R) of 0.662 and weighted average of 21.4%, a difference of 16.9%.
Single Female Poverty Correlation Summary
| Measurement | Blackfeet | Irish |
| Minimum | 6.1% | 7.7% |
| Maximum | 100.0% | 100.0% |
| Range | 93.9% | 92.3% |
| Mean | 43.8% | 34.3% |
| Median | 37.2% | 21.2% |
| Interquartile 25% (IQ1) | 26.7% | 17.4% |
| Interquartile 75% (IQ3) | 56.2% | 34.5% |
| Interquartile Range (IQR) | 29.6% | 17.1% |
| Standard Deviation (Sample) | 23.9% | 28.5% |
| Standard Deviation (Population) | 23.6% | 28.4% |
Similar Demographics by Single Female Poverty
Demographics Similar to Blackfeet by Single Female Poverty
In terms of single female poverty, the demographic groups most similar to Blackfeet are Mexican (25.0%, a difference of 0.080%), Honduran (25.1%, a difference of 0.18%), Shoshone (25.1%, a difference of 0.26%), Somali (25.2%, a difference of 0.66%), and Yaqui (24.9%, a difference of 0.74%).
| Demographics | Rating | Rank | Single Female Poverty |
| Americans | 0.0 /100 | #293 | Tragic 24.5% |
| French American Indians | 0.0 /100 | #294 | Tragic 24.6% |
| Hispanics or Latinos | 0.0 /100 | #295 | Tragic 24.6% |
| Africans | 0.0 /100 | #296 | Tragic 24.8% |
| Immigrants | Central America | 0.0 /100 | #297 | Tragic 24.8% |
| Yaqui | 0.0 /100 | #298 | Tragic 24.9% |
| Mexicans | 0.0 /100 | #299 | Tragic 25.0% |
| Blackfeet | 0.0 /100 | #300 | Tragic 25.1% |
| Hondurans | 0.0 /100 | #301 | Tragic 25.1% |
| Shoshone | 0.0 /100 | #302 | Tragic 25.1% |
| Somalis | 0.0 /100 | #303 | Tragic 25.2% |
| Immigrants | Congo | 0.0 /100 | #304 | Tragic 25.3% |
| Immigrants | Dominican Republic | 0.0 /100 | #305 | Tragic 25.3% |
| Immigrants | Mexico | 0.0 /100 | #306 | Tragic 25.3% |
| Potawatomi | 0.0 /100 | #307 | Tragic 25.4% |
Demographics Similar to Irish by Single Female Poverty
In terms of single female poverty, the demographic groups most similar to Irish are Nigerian (21.4%, a difference of 0.040%), Immigrants (21.4%, a difference of 0.050%), Immigrants from Kenya (21.4%, a difference of 0.070%), Swiss (21.4%, a difference of 0.25%), and Immigrants from Haiti (21.5%, a difference of 0.25%).
| Demographics | Rating | Rank | Single Female Poverty |
| Basques | 28.1 /100 | #193 | Fair 21.3% |
| Czechoslovakians | 27.7 /100 | #194 | Fair 21.3% |
| Nicaraguans | 27.6 /100 | #195 | Fair 21.3% |
| Immigrants | Saudi Arabia | 27.1 /100 | #196 | Fair 21.3% |
| Japanese | 26.4 /100 | #197 | Fair 21.3% |
| Swiss | 24.2 /100 | #198 | Fair 21.4% |
| Immigrants | Immigrants | 22.0 /100 | #199 | Fair 21.4% |
| Irish | 21.4 /100 | #200 | Fair 21.4% |
| Nigerians | 20.9 /100 | #201 | Fair 21.4% |
| Immigrants | Kenya | 20.7 /100 | #202 | Fair 21.4% |
| Immigrants | Haiti | 18.8 /100 | #203 | Poor 21.5% |
| Immigrants | Africa | 16.7 /100 | #204 | Poor 21.5% |
| Finns | 16.2 /100 | #205 | Poor 21.5% |
| Belgians | 16.1 /100 | #206 | Poor 21.5% |
| Ghanaians | 15.7 /100 | #207 | Poor 21.6% |