Filipino vs Dutch Single Female Poverty
COMPARE
Filipino
Dutch
Single Female Poverty
Single Female Poverty Comparison
Filipinos
Dutch
17.0%
SINGLE FEMALE POVERTY
100.0/ 100
METRIC RATING
6th/ 347
METRIC RANK
22.0%
SINGLE FEMALE POVERTY
4.6/ 100
METRIC RATING
235th/ 347
METRIC RANK
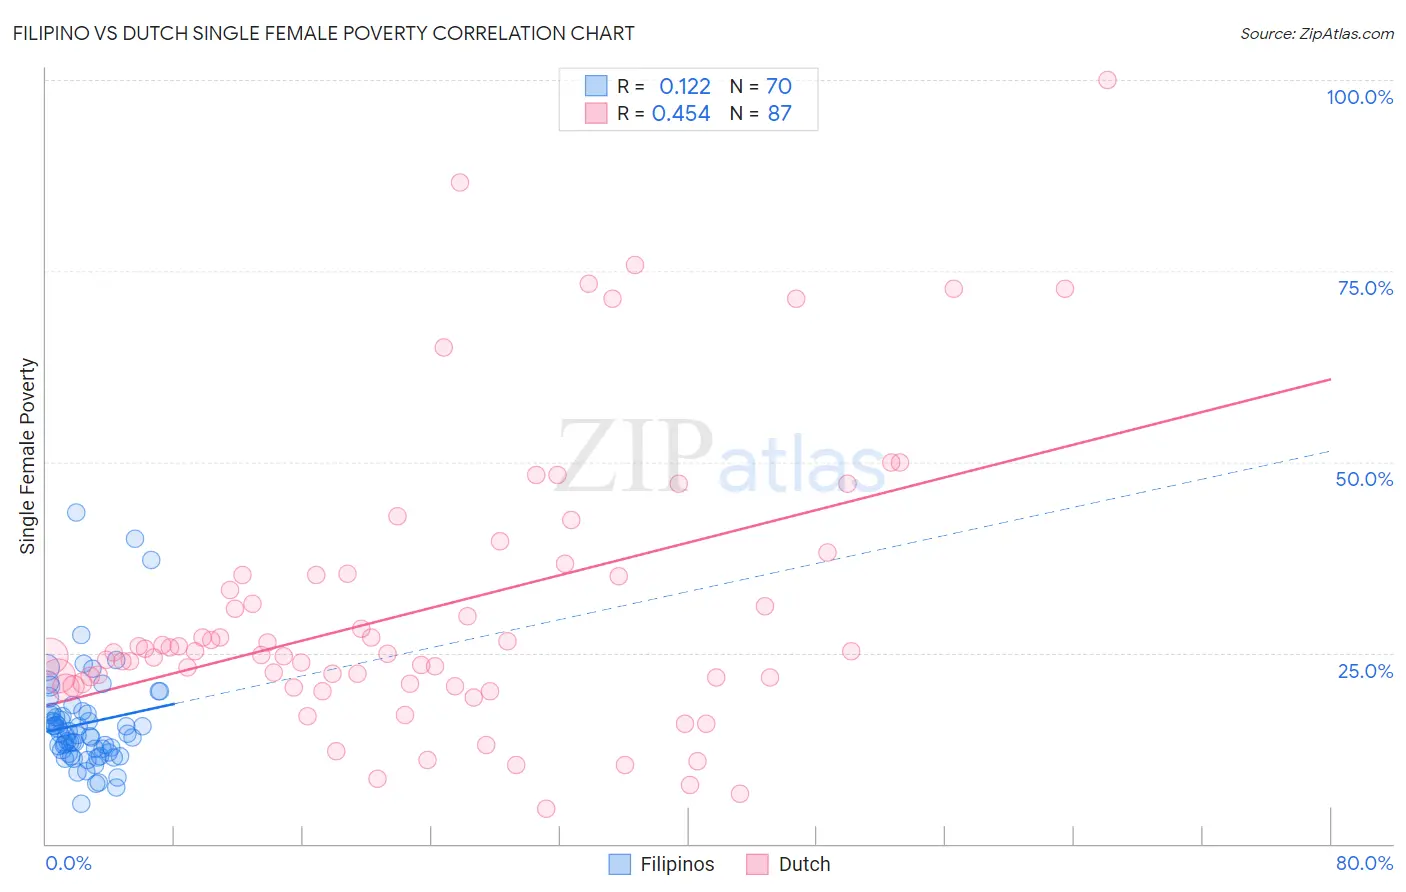
Filipino vs Dutch Single Female Poverty Correlation Chart
The statistical analysis conducted on geographies consisting of 251,336,668 people shows a poor positive correlation between the proportion of Filipinos and poverty level among single females in the United States with a correlation coefficient (R) of 0.122 and weighted average of 17.0%. Similarly, the statistical analysis conducted on geographies consisting of 536,025,433 people shows a moderate positive correlation between the proportion of Dutch and poverty level among single females in the United States with a correlation coefficient (R) of 0.454 and weighted average of 22.0%, a difference of 29.5%.
Single Female Poverty Correlation Summary
| Measurement | Filipino | Dutch |
| Minimum | 5.2% | 4.6% |
| Maximum | 43.4% | 100.0% |
| Range | 38.2% | 95.4% |
| Mean | 15.8% | 30.8% |
| Median | 14.3% | 25.0% |
| Interquartile 25% (IQ1) | 12.0% | 20.9% |
| Interquartile 75% (IQ3) | 17.1% | 35.2% |
| Interquartile Range (IQR) | 5.1% | 14.3% |
| Standard Deviation (Sample) | 6.7% | 18.7% |
| Standard Deviation (Population) | 6.7% | 18.6% |
Similar Demographics by Single Female Poverty
Demographics Similar to Filipinos by Single Female Poverty
In terms of single female poverty, the demographic groups most similar to Filipinos are Assyrian/Chaldean/Syriac (17.0%, a difference of 0.20%), Immigrants from India (16.8%, a difference of 1.0%), Thai (17.3%, a difference of 1.7%), Immigrants from Iran (17.5%, a difference of 2.8%), and Immigrants from Hong Kong (16.5%, a difference of 2.8%).
| Demographics | Rating | Rank | Single Female Poverty |
| Chinese | 100.0 /100 | #1 | Exceptional 16.1% |
| Immigrants | Taiwan | 100.0 /100 | #2 | Exceptional 16.4% |
| Immigrants | Hong Kong | 100.0 /100 | #3 | Exceptional 16.5% |
| Immigrants | India | 100.0 /100 | #4 | Exceptional 16.8% |
| Assyrians/Chaldeans/Syriacs | 100.0 /100 | #5 | Exceptional 17.0% |
| Filipinos | 100.0 /100 | #6 | Exceptional 17.0% |
| Thais | 100.0 /100 | #7 | Exceptional 17.3% |
| Immigrants | Iran | 100.0 /100 | #8 | Exceptional 17.5% |
| Bhutanese | 100.0 /100 | #9 | Exceptional 17.7% |
| Immigrants | Ireland | 100.0 /100 | #10 | Exceptional 17.8% |
| Immigrants | Lithuania | 100.0 /100 | #11 | Exceptional 17.8% |
| Immigrants | South Central Asia | 100.0 /100 | #12 | Exceptional 17.8% |
| Immigrants | Bolivia | 100.0 /100 | #13 | Exceptional 17.8% |
| Bolivians | 100.0 /100 | #14 | Exceptional 17.9% |
| Indians (Asian) | 100.0 /100 | #15 | Exceptional 17.9% |
Demographics Similar to Dutch by Single Female Poverty
In terms of single female poverty, the demographic groups most similar to Dutch are Spaniard (22.0%, a difference of 0.020%), Spanish (22.0%, a difference of 0.020%), Immigrants from Thailand (22.0%, a difference of 0.12%), Welsh (22.0%, a difference of 0.13%), and Immigrants from Ecuador (22.0%, a difference of 0.16%).
| Demographics | Rating | Rank | Single Female Poverty |
| Salvadorans | 5.5 /100 | #228 | Tragic 21.9% |
| Tlingit-Haida | 5.4 /100 | #229 | Tragic 21.9% |
| Immigrants | Western Africa | 5.3 /100 | #230 | Tragic 22.0% |
| Welsh | 5.0 /100 | #231 | Tragic 22.0% |
| Immigrants | Thailand | 5.0 /100 | #232 | Tragic 22.0% |
| Spaniards | 4.7 /100 | #233 | Tragic 22.0% |
| Spanish | 4.7 /100 | #234 | Tragic 22.0% |
| Dutch | 4.6 /100 | #235 | Tragic 22.0% |
| Immigrants | Ecuador | 4.2 /100 | #236 | Tragic 22.0% |
| Vietnamese | 4.0 /100 | #237 | Tragic 22.0% |
| French Canadians | 2.8 /100 | #238 | Tragic 22.2% |
| Malaysians | 2.8 /100 | #239 | Tragic 22.2% |
| French | 2.3 /100 | #240 | Tragic 22.2% |
| Cape Verdeans | 2.1 /100 | #241 | Tragic 22.3% |
| Bermudans | 2.0 /100 | #242 | Tragic 22.3% |