Immigrants from Guatemala vs British Single Mother Poverty
COMPARE
Immigrants from Guatemala
British
Single Mother Poverty
Single Mother Poverty Comparison
Immigrants from Guatemala
British
33.3%
SINGLE MOTHER POVERTY
0.0/ 100
METRIC RATING
299th/ 347
METRIC RANK
29.2%
SINGLE MOTHER POVERTY
50.6/ 100
METRIC RATING
173rd/ 347
METRIC RANK
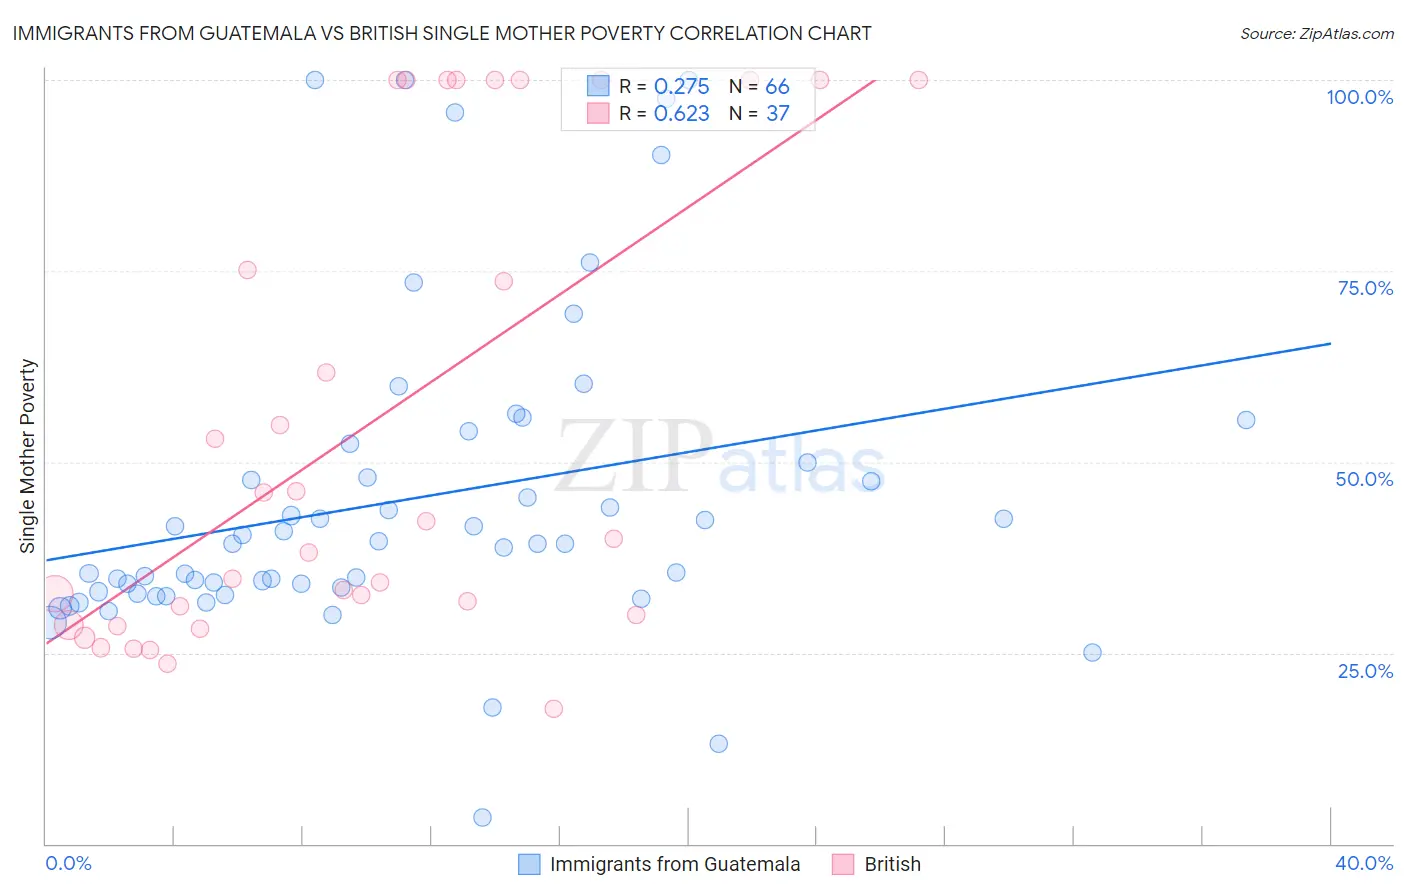
Immigrants from Guatemala vs British Single Mother Poverty Correlation Chart
The statistical analysis conducted on geographies consisting of 371,171,029 people shows a weak positive correlation between the proportion of Immigrants from Guatemala and poverty level among single mothers in the United States with a correlation coefficient (R) of 0.275 and weighted average of 33.3%. Similarly, the statistical analysis conducted on geographies consisting of 510,068,418 people shows a significant positive correlation between the proportion of British and poverty level among single mothers in the United States with a correlation coefficient (R) of 0.623 and weighted average of 29.2%, a difference of 14.2%.
Single Mother Poverty Correlation Summary
| Measurement | Immigrants from Guatemala | British |
| Minimum | 3.4% | 17.7% |
| Maximum | 100.0% | 100.0% |
| Range | 96.6% | 82.3% |
| Mean | 45.0% | 54.6% |
| Median | 39.3% | 40.0% |
| Interquartile 25% (IQ1) | 33.0% | 29.4% |
| Interquartile 75% (IQ3) | 50.0% | 100.0% |
| Interquartile Range (IQR) | 17.0% | 70.6% |
| Standard Deviation (Sample) | 20.7% | 30.6% |
| Standard Deviation (Population) | 20.5% | 30.2% |
Similar Demographics by Single Mother Poverty
Demographics Similar to Immigrants from Guatemala by Single Mother Poverty
In terms of single mother poverty, the demographic groups most similar to Immigrants from Guatemala are Hispanic or Latino (33.3%, a difference of 0.0%), African (33.3%, a difference of 0.090%), Pennsylvania German (33.2%, a difference of 0.20%), Immigrants from Somalia (33.4%, a difference of 0.25%), and Blackfeet (33.2%, a difference of 0.34%).
| Demographics | Rating | Rank | Single Mother Poverty |
| Shoshone | 0.0 /100 | #292 | Tragic 32.9% |
| Aleuts | 0.0 /100 | #293 | Tragic 32.9% |
| French American Indians | 0.0 /100 | #294 | Tragic 33.1% |
| Yaqui | 0.0 /100 | #295 | Tragic 33.1% |
| Blackfeet | 0.0 /100 | #296 | Tragic 33.2% |
| Pennsylvania Germans | 0.0 /100 | #297 | Tragic 33.2% |
| Africans | 0.0 /100 | #298 | Tragic 33.3% |
| Immigrants | Guatemala | 0.0 /100 | #299 | Tragic 33.3% |
| Hispanics or Latinos | 0.0 /100 | #300 | Tragic 33.3% |
| Immigrants | Somalia | 0.0 /100 | #301 | Tragic 33.4% |
| Arapaho | 0.0 /100 | #302 | Tragic 33.4% |
| Americans | 0.0 /100 | #303 | Tragic 33.5% |
| Mexicans | 0.0 /100 | #304 | Tragic 33.6% |
| Immigrants | Central America | 0.0 /100 | #305 | Tragic 33.6% |
| Immigrants | Congo | 0.0 /100 | #306 | Tragic 33.8% |
Demographics Similar to British by Single Mother Poverty
In terms of single mother poverty, the demographic groups most similar to British are Immigrants from Saudi Arabia (29.2%, a difference of 0.030%), Immigrants from Costa Rica (29.2%, a difference of 0.090%), Hawaiian (29.2%, a difference of 0.13%), Carpatho Rusyn (29.1%, a difference of 0.16%), and New Zealander (29.1%, a difference of 0.22%).
| Demographics | Rating | Rank | Single Mother Poverty |
| Inupiat | 60.4 /100 | #166 | Good 29.0% |
| Costa Ricans | 58.4 /100 | #167 | Average 29.0% |
| Europeans | 57.6 /100 | #168 | Average 29.1% |
| Immigrants | Uruguay | 57.2 /100 | #169 | Average 29.1% |
| New Zealanders | 55.1 /100 | #170 | Average 29.1% |
| Puget Sound Salish | 55.1 /100 | #171 | Average 29.1% |
| Carpatho Rusyns | 53.8 /100 | #172 | Average 29.1% |
| British | 50.6 /100 | #173 | Average 29.2% |
| Immigrants | Saudi Arabia | 50.0 /100 | #174 | Average 29.2% |
| Immigrants | Costa Rica | 48.8 /100 | #175 | Average 29.2% |
| Hawaiians | 47.8 /100 | #176 | Average 29.2% |
| Immigrants | Bosnia and Herzegovina | 45.1 /100 | #177 | Average 29.2% |
| South American Indians | 43.2 /100 | #178 | Average 29.3% |
| Immigrants | Uzbekistan | 42.6 /100 | #179 | Average 29.3% |
| Immigrants | Norway | 41.5 /100 | #180 | Average 29.3% |