Navajo vs British Ambulatory Disability
COMPARE
Navajo
British
Ambulatory Disability
Ambulatory Disability Comparison
Navajo
British
7.5%
AMBULATORY DISABILITY
0.0/ 100
METRIC RATING
324th/ 347
METRIC RANK
6.2%
AMBULATORY DISABILITY
34.3/ 100
METRIC RATING
188th/ 347
METRIC RANK
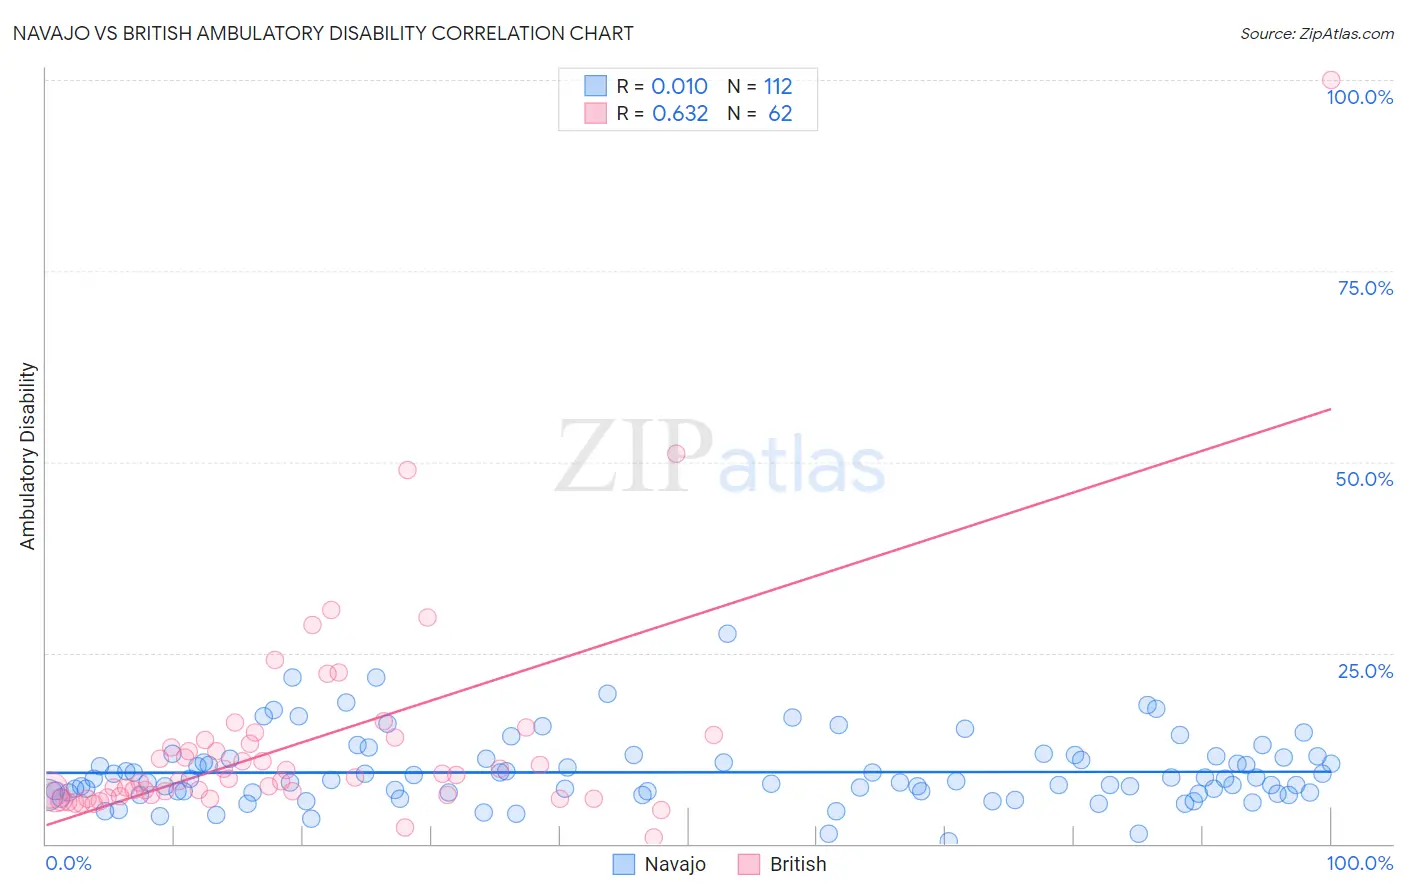
Navajo vs British Ambulatory Disability Correlation Chart
The statistical analysis conducted on geographies consisting of 224,747,889 people shows no correlation between the proportion of Navajo and percentage of population with ambulatory disability in the United States with a correlation coefficient (R) of 0.010 and weighted average of 7.5%. Similarly, the statistical analysis conducted on geographies consisting of 531,154,282 people shows a significant positive correlation between the proportion of British and percentage of population with ambulatory disability in the United States with a correlation coefficient (R) of 0.632 and weighted average of 6.2%, a difference of 21.7%.
Ambulatory Disability Correlation Summary
| Measurement | Navajo | British |
| Minimum | 0.36% | 0.87% |
| Maximum | 27.6% | 100.0% |
| Range | 27.2% | 99.1% |
| Mean | 9.4% | 13.1% |
| Median | 8.3% | 8.6% |
| Interquartile 25% (IQ1) | 6.7% | 6.3% |
| Interquartile 75% (IQ3) | 11.2% | 13.6% |
| Interquartile Range (IQR) | 4.5% | 7.3% |
| Standard Deviation (Sample) | 4.5% | 14.6% |
| Standard Deviation (Population) | 4.5% | 14.5% |
Similar Demographics by Ambulatory Disability
Demographics Similar to Navajo by Ambulatory Disability
In terms of ambulatory disability, the demographic groups most similar to Navajo are Comanche (7.5%, a difference of 0.070%), Black/African American (7.5%, a difference of 0.18%), Native/Alaskan (7.5%, a difference of 0.20%), Hopi (7.6%, a difference of 1.1%), and Pueblo (7.6%, a difference of 1.2%).
| Demographics | Rating | Rank | Ambulatory Disability |
| Central American Indians | 0.0 /100 | #317 | Tragic 7.2% |
| Ottawa | 0.0 /100 | #318 | Tragic 7.2% |
| Dominicans | 0.0 /100 | #319 | Tragic 7.2% |
| Potawatomi | 0.0 /100 | #320 | Tragic 7.3% |
| Apache | 0.0 /100 | #321 | Tragic 7.4% |
| Osage | 0.0 /100 | #322 | Tragic 7.4% |
| Americans | 0.0 /100 | #323 | Tragic 7.4% |
| Navajo | 0.0 /100 | #324 | Tragic 7.5% |
| Comanche | 0.0 /100 | #325 | Tragic 7.5% |
| Blacks/African Americans | 0.0 /100 | #326 | Tragic 7.5% |
| Natives/Alaskans | 0.0 /100 | #327 | Tragic 7.5% |
| Hopi | 0.0 /100 | #328 | Tragic 7.6% |
| Pueblo | 0.0 /100 | #329 | Tragic 7.6% |
| Paiute | 0.0 /100 | #330 | Tragic 7.7% |
| Cajuns | 0.0 /100 | #331 | Tragic 7.8% |
Demographics Similar to British by Ambulatory Disability
In terms of ambulatory disability, the demographic groups most similar to British are Ukrainian (6.2%, a difference of 0.020%), Immigrants from Western Africa (6.2%, a difference of 0.050%), Carpatho Rusyn (6.2%, a difference of 0.060%), European (6.2%, a difference of 0.11%), and Immigrants from Guatemala (6.2%, a difference of 0.14%).
| Demographics | Rating | Rank | Ambulatory Disability |
| Swiss | 43.1 /100 | #181 | Average 6.1% |
| Serbians | 42.8 /100 | #182 | Average 6.1% |
| Immigrants | Thailand | 42.2 /100 | #183 | Average 6.1% |
| Immigrants | Ghana | 41.2 /100 | #184 | Average 6.1% |
| Immigrants | Bosnia and Herzegovina | 37.2 /100 | #185 | Fair 6.2% |
| Europeans | 36.2 /100 | #186 | Fair 6.2% |
| Carpatho Rusyns | 35.3 /100 | #187 | Fair 6.2% |
| British | 34.3 /100 | #188 | Fair 6.2% |
| Ukrainians | 34.0 /100 | #189 | Fair 6.2% |
| Immigrants | Western Africa | 33.4 /100 | #190 | Fair 6.2% |
| Immigrants | Guatemala | 31.9 /100 | #191 | Fair 6.2% |
| Immigrants | Western Europe | 31.6 /100 | #192 | Fair 6.2% |
| Guatemalans | 30.0 /100 | #193 | Fair 6.2% |
| Alaska Natives | 29.8 /100 | #194 | Fair 6.2% |
| Belgians | 28.6 /100 | #195 | Fair 6.2% |