Aleut vs British Single Mother Poverty
COMPARE
Aleut
British
Single Mother Poverty
Single Mother Poverty Comparison
Aleuts
British
32.9%
SINGLE MOTHER POVERTY
0.0/ 100
METRIC RATING
293rd/ 347
METRIC RANK
29.2%
SINGLE MOTHER POVERTY
50.6/ 100
METRIC RATING
173rd/ 347
METRIC RANK
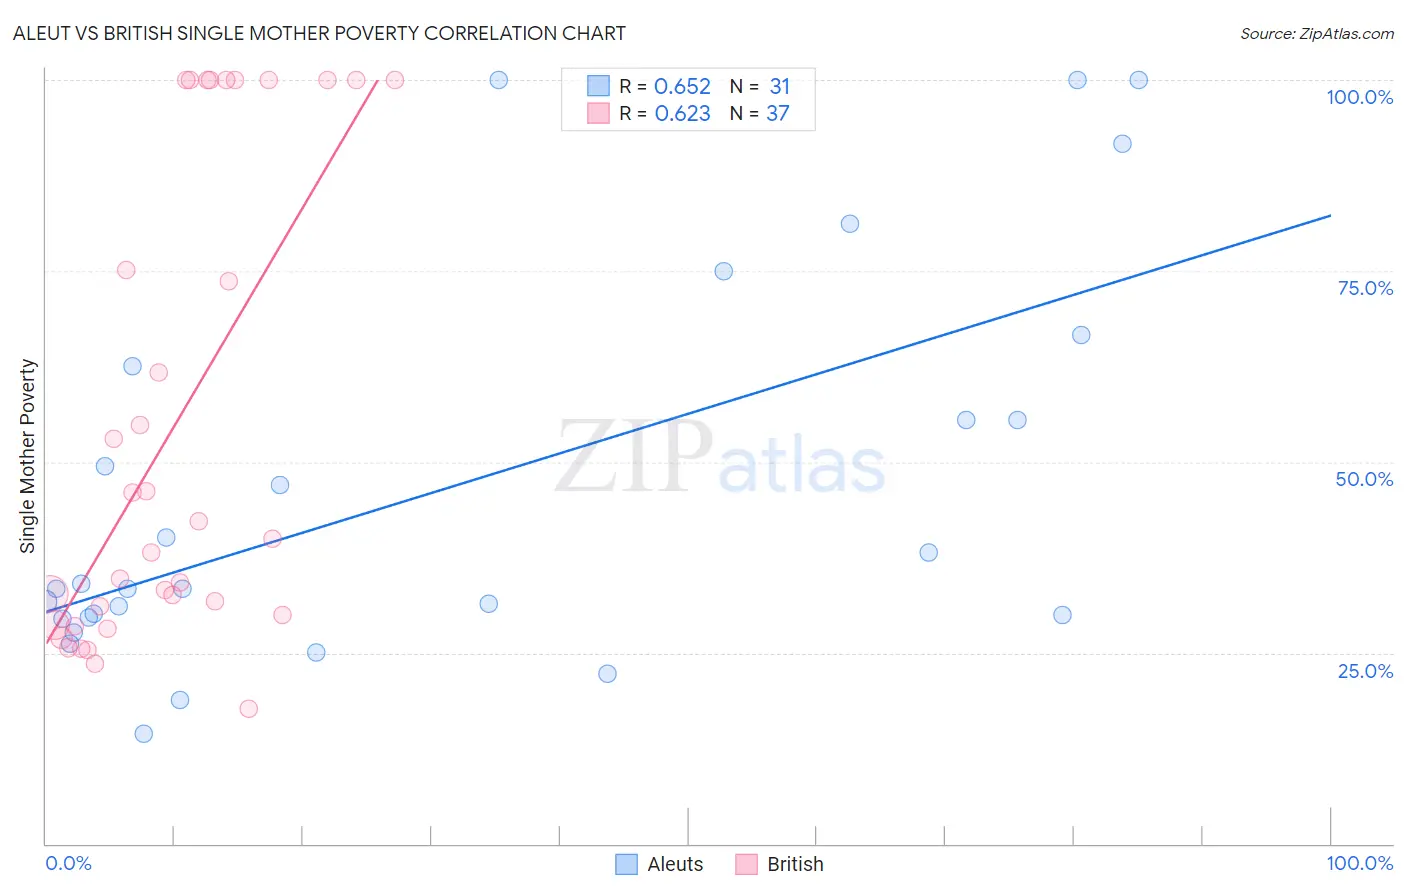
Aleut vs British Single Mother Poverty Correlation Chart
The statistical analysis conducted on geographies consisting of 61,416,159 people shows a significant positive correlation between the proportion of Aleuts and poverty level among single mothers in the United States with a correlation coefficient (R) of 0.652 and weighted average of 32.9%. Similarly, the statistical analysis conducted on geographies consisting of 510,068,418 people shows a significant positive correlation between the proportion of British and poverty level among single mothers in the United States with a correlation coefficient (R) of 0.623 and weighted average of 29.2%, a difference of 12.9%.
Single Mother Poverty Correlation Summary
| Measurement | Aleut | British |
| Minimum | 14.4% | 17.7% |
| Maximum | 100.0% | 100.0% |
| Range | 85.6% | 82.3% |
| Mean | 46.6% | 54.6% |
| Median | 33.4% | 40.0% |
| Interquartile 25% (IQ1) | 29.6% | 29.4% |
| Interquartile 75% (IQ3) | 62.5% | 100.0% |
| Interquartile Range (IQR) | 32.9% | 70.6% |
| Standard Deviation (Sample) | 25.6% | 30.6% |
| Standard Deviation (Population) | 25.2% | 30.2% |
Similar Demographics by Single Mother Poverty
Demographics Similar to Aleuts by Single Mother Poverty
In terms of single mother poverty, the demographic groups most similar to Aleuts are Shoshone (32.9%, a difference of 0.030%), Guatemalan (32.9%, a difference of 0.050%), French American Indian (33.1%, a difference of 0.63%), Yaqui (33.1%, a difference of 0.66%), and Blackfeet (33.2%, a difference of 0.82%).
| Demographics | Rating | Rank | Single Mother Poverty |
| Yup'ik | 0.0 /100 | #286 | Tragic 32.5% |
| Immigrants | Dominica | 0.0 /100 | #287 | Tragic 32.5% |
| Somalis | 0.0 /100 | #288 | Tragic 32.6% |
| U.S. Virgin Islanders | 0.0 /100 | #289 | Tragic 32.6% |
| Osage | 0.0 /100 | #290 | Tragic 32.6% |
| Guatemalans | 0.0 /100 | #291 | Tragic 32.9% |
| Shoshone | 0.0 /100 | #292 | Tragic 32.9% |
| Aleuts | 0.0 /100 | #293 | Tragic 32.9% |
| French American Indians | 0.0 /100 | #294 | Tragic 33.1% |
| Yaqui | 0.0 /100 | #295 | Tragic 33.1% |
| Blackfeet | 0.0 /100 | #296 | Tragic 33.2% |
| Pennsylvania Germans | 0.0 /100 | #297 | Tragic 33.2% |
| Africans | 0.0 /100 | #298 | Tragic 33.3% |
| Immigrants | Guatemala | 0.0 /100 | #299 | Tragic 33.3% |
| Hispanics or Latinos | 0.0 /100 | #300 | Tragic 33.3% |
Demographics Similar to British by Single Mother Poverty
In terms of single mother poverty, the demographic groups most similar to British are Immigrants from Saudi Arabia (29.2%, a difference of 0.030%), Immigrants from Costa Rica (29.2%, a difference of 0.090%), Hawaiian (29.2%, a difference of 0.13%), Carpatho Rusyn (29.1%, a difference of 0.16%), and New Zealander (29.1%, a difference of 0.22%).
| Demographics | Rating | Rank | Single Mother Poverty |
| Inupiat | 60.4 /100 | #166 | Good 29.0% |
| Costa Ricans | 58.4 /100 | #167 | Average 29.0% |
| Europeans | 57.6 /100 | #168 | Average 29.1% |
| Immigrants | Uruguay | 57.2 /100 | #169 | Average 29.1% |
| New Zealanders | 55.1 /100 | #170 | Average 29.1% |
| Puget Sound Salish | 55.1 /100 | #171 | Average 29.1% |
| Carpatho Rusyns | 53.8 /100 | #172 | Average 29.1% |
| British | 50.6 /100 | #173 | Average 29.2% |
| Immigrants | Saudi Arabia | 50.0 /100 | #174 | Average 29.2% |
| Immigrants | Costa Rica | 48.8 /100 | #175 | Average 29.2% |
| Hawaiians | 47.8 /100 | #176 | Average 29.2% |
| Immigrants | Bosnia and Herzegovina | 45.1 /100 | #177 | Average 29.2% |
| South American Indians | 43.2 /100 | #178 | Average 29.3% |
| Immigrants | Uzbekistan | 42.6 /100 | #179 | Average 29.3% |
| Immigrants | Norway | 41.5 /100 | #180 | Average 29.3% |