Macedonian vs Yuman Single Female Poverty
COMPARE
Macedonian
Yuman
Single Female Poverty
Single Female Poverty Comparison
Macedonians
Yuman
18.9%
SINGLE FEMALE POVERTY
99.8/ 100
METRIC RATING
46th/ 347
METRIC RANK
29.4%
SINGLE FEMALE POVERTY
0.0/ 100
METRIC RATING
337th/ 347
METRIC RANK
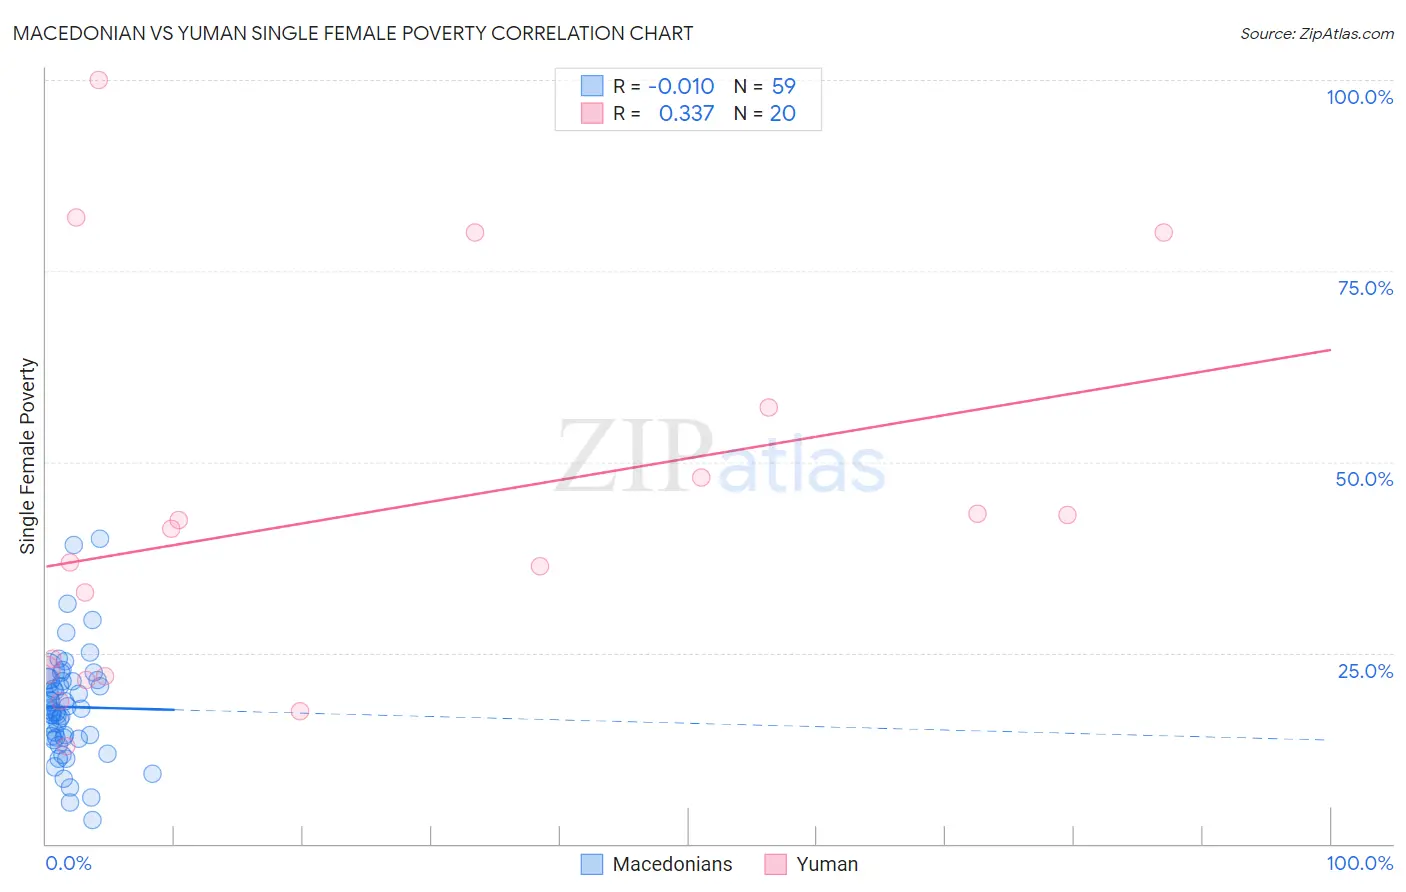
Macedonian vs Yuman Single Female Poverty Correlation Chart
The statistical analysis conducted on geographies consisting of 131,464,116 people shows no correlation between the proportion of Macedonians and poverty level among single females in the United States with a correlation coefficient (R) of -0.010 and weighted average of 18.9%. Similarly, the statistical analysis conducted on geographies consisting of 40,574,686 people shows a mild positive correlation between the proportion of Yuman and poverty level among single females in the United States with a correlation coefficient (R) of 0.337 and weighted average of 29.4%, a difference of 55.4%.
Single Female Poverty Correlation Summary
| Measurement | Macedonian | Yuman |
| Minimum | 3.0% | 12.7% |
| Maximum | 40.0% | 100.0% |
| Range | 37.0% | 87.3% |
| Mean | 17.9% | 43.1% |
| Median | 17.6% | 39.0% |
| Interquartile 25% (IQ1) | 13.9% | 22.3% |
| Interquartile 75% (IQ3) | 21.4% | 52.6% |
| Interquartile Range (IQR) | 7.5% | 30.3% |
| Standard Deviation (Sample) | 7.0% | 24.9% |
| Standard Deviation (Population) | 6.9% | 24.2% |
Similar Demographics by Single Female Poverty
Demographics Similar to Macedonians by Single Female Poverty
In terms of single female poverty, the demographic groups most similar to Macedonians are Immigrants from Indonesia (18.9%, a difference of 0.16%), Latvian (19.0%, a difference of 0.19%), Immigrants from Croatia (18.9%, a difference of 0.38%), Immigrants from Argentina (19.0%, a difference of 0.46%), and Immigrants from Czechoslovakia (19.0%, a difference of 0.47%).
| Demographics | Rating | Rank | Single Female Poverty |
| Bulgarians | 99.9 /100 | #39 | Exceptional 18.8% |
| Okinawans | 99.9 /100 | #40 | Exceptional 18.8% |
| Immigrants | Serbia | 99.9 /100 | #41 | Exceptional 18.8% |
| Jordanians | 99.9 /100 | #42 | Exceptional 18.8% |
| Immigrants | Romania | 99.9 /100 | #43 | Exceptional 18.8% |
| Immigrants | Croatia | 99.9 /100 | #44 | Exceptional 18.9% |
| Immigrants | Indonesia | 99.8 /100 | #45 | Exceptional 18.9% |
| Macedonians | 99.8 /100 | #46 | Exceptional 18.9% |
| Latvians | 99.8 /100 | #47 | Exceptional 19.0% |
| Immigrants | Argentina | 99.8 /100 | #48 | Exceptional 19.0% |
| Immigrants | Czechoslovakia | 99.8 /100 | #49 | Exceptional 19.0% |
| Immigrants | Eastern Europe | 99.8 /100 | #50 | Exceptional 19.0% |
| Immigrants | Italy | 99.8 /100 | #51 | Exceptional 19.0% |
| Egyptians | 99.7 /100 | #52 | Exceptional 19.1% |
| Tsimshian | 99.7 /100 | #53 | Exceptional 19.1% |
Demographics Similar to Yuman by Single Female Poverty
In terms of single female poverty, the demographic groups most similar to Yuman are Colville (29.1%, a difference of 1.3%), Immigrants from Yemen (28.9%, a difference of 1.8%), Pueblo (28.6%, a difference of 2.9%), Pima (30.3%, a difference of 3.0%), and Cheyenne (30.4%, a difference of 3.2%).
| Demographics | Rating | Rank | Single Female Poverty |
| Hopi | 0.0 /100 | #330 | Tragic 28.0% |
| Natives/Alaskans | 0.0 /100 | #331 | Tragic 28.2% |
| Yakama | 0.0 /100 | #332 | Tragic 28.3% |
| Ute | 0.0 /100 | #333 | Tragic 28.4% |
| Pueblo | 0.0 /100 | #334 | Tragic 28.6% |
| Immigrants | Yemen | 0.0 /100 | #335 | Tragic 28.9% |
| Colville | 0.0 /100 | #336 | Tragic 29.1% |
| Yuman | 0.0 /100 | #337 | Tragic 29.4% |
| Pima | 0.0 /100 | #338 | Tragic 30.3% |
| Cheyenne | 0.0 /100 | #339 | Tragic 30.4% |
| Cajuns | 0.0 /100 | #340 | Tragic 30.6% |
| Sioux | 0.0 /100 | #341 | Tragic 31.3% |
| Navajo | 0.0 /100 | #342 | Tragic 31.7% |
| Crow | 0.0 /100 | #343 | Tragic 32.4% |
| Lumbee | 0.0 /100 | #344 | Tragic 33.0% |