Luxembourger vs Yuman Single Female Poverty
COMPARE
Luxembourger
Yuman
Single Female Poverty
Single Female Poverty Comparison
Luxembourgers
Yuman
20.4%
SINGLE FEMALE POVERTY
84.9/ 100
METRIC RATING
148th/ 347
METRIC RANK
29.4%
SINGLE FEMALE POVERTY
0.0/ 100
METRIC RATING
337th/ 347
METRIC RANK
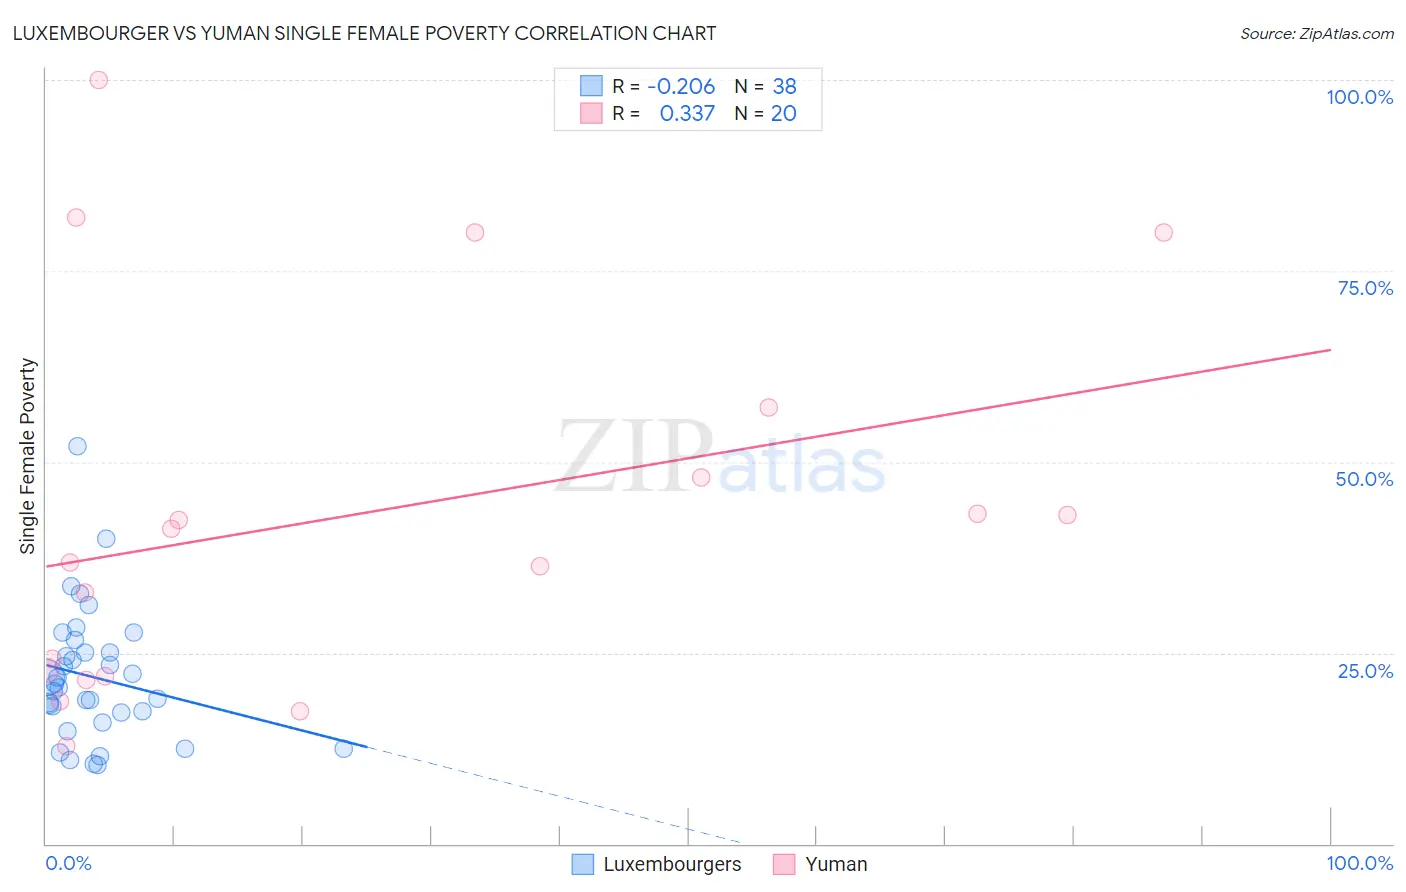
Luxembourger vs Yuman Single Female Poverty Correlation Chart
The statistical analysis conducted on geographies consisting of 143,364,483 people shows a weak negative correlation between the proportion of Luxembourgers and poverty level among single females in the United States with a correlation coefficient (R) of -0.206 and weighted average of 20.4%. Similarly, the statistical analysis conducted on geographies consisting of 40,574,686 people shows a mild positive correlation between the proportion of Yuman and poverty level among single females in the United States with a correlation coefficient (R) of 0.337 and weighted average of 29.4%, a difference of 44.0%.
Single Female Poverty Correlation Summary
| Measurement | Luxembourger | Yuman |
| Minimum | 10.2% | 12.7% |
| Maximum | 52.1% | 100.0% |
| Range | 41.9% | 87.3% |
| Mean | 21.8% | 43.1% |
| Median | 20.7% | 39.0% |
| Interquartile 25% (IQ1) | 17.3% | 22.3% |
| Interquartile 75% (IQ3) | 25.0% | 52.6% |
| Interquartile Range (IQR) | 7.7% | 30.3% |
| Standard Deviation (Sample) | 8.6% | 24.9% |
| Standard Deviation (Population) | 8.5% | 24.2% |
Similar Demographics by Single Female Poverty
Demographics Similar to Luxembourgers by Single Female Poverty
In terms of single female poverty, the demographic groups most similar to Luxembourgers are South African (20.4%, a difference of 0.050%), Venezuelan (20.4%, a difference of 0.080%), Austrian (20.4%, a difference of 0.11%), Portuguese (20.5%, a difference of 0.39%), and Immigrants from Uzbekistan (20.3%, a difference of 0.47%).
| Demographics | Rating | Rank | Single Female Poverty |
| Immigrants | North America | 89.5 /100 | #141 | Excellent 20.3% |
| Immigrants | Uganda | 89.1 /100 | #142 | Excellent 20.3% |
| Australians | 88.4 /100 | #143 | Excellent 20.3% |
| Immigrants | Uzbekistan | 88.3 /100 | #144 | Excellent 20.3% |
| Austrians | 85.8 /100 | #145 | Excellent 20.4% |
| Venezuelans | 85.5 /100 | #146 | Excellent 20.4% |
| South Africans | 85.3 /100 | #147 | Excellent 20.4% |
| Luxembourgers | 84.9 /100 | #148 | Excellent 20.4% |
| Portuguese | 81.5 /100 | #149 | Excellent 20.5% |
| Immigrants | Denmark | 80.5 /100 | #150 | Excellent 20.5% |
| Puget Sound Salish | 79.6 /100 | #151 | Good 20.6% |
| Immigrants | Uruguay | 77.7 /100 | #152 | Good 20.6% |
| Swedes | 77.1 /100 | #153 | Good 20.6% |
| Immigrants | Western Europe | 76.7 /100 | #154 | Good 20.6% |
| Samoans | 76.0 /100 | #155 | Good 20.6% |
Demographics Similar to Yuman by Single Female Poverty
In terms of single female poverty, the demographic groups most similar to Yuman are Colville (29.1%, a difference of 1.3%), Immigrants from Yemen (28.9%, a difference of 1.8%), Pueblo (28.6%, a difference of 2.9%), Pima (30.3%, a difference of 3.0%), and Cheyenne (30.4%, a difference of 3.2%).
| Demographics | Rating | Rank | Single Female Poverty |
| Hopi | 0.0 /100 | #330 | Tragic 28.0% |
| Natives/Alaskans | 0.0 /100 | #331 | Tragic 28.2% |
| Yakama | 0.0 /100 | #332 | Tragic 28.3% |
| Ute | 0.0 /100 | #333 | Tragic 28.4% |
| Pueblo | 0.0 /100 | #334 | Tragic 28.6% |
| Immigrants | Yemen | 0.0 /100 | #335 | Tragic 28.9% |
| Colville | 0.0 /100 | #336 | Tragic 29.1% |
| Yuman | 0.0 /100 | #337 | Tragic 29.4% |
| Pima | 0.0 /100 | #338 | Tragic 30.3% |
| Cheyenne | 0.0 /100 | #339 | Tragic 30.4% |
| Cajuns | 0.0 /100 | #340 | Tragic 30.6% |
| Sioux | 0.0 /100 | #341 | Tragic 31.3% |
| Navajo | 0.0 /100 | #342 | Tragic 31.7% |
| Crow | 0.0 /100 | #343 | Tragic 32.4% |
| Lumbee | 0.0 /100 | #344 | Tragic 33.0% |