Macedonian vs Yuman Per Capita Income
COMPARE
Macedonian
Yuman
Per Capita Income
Per Capita Income Comparison
Macedonians
Yuman
$47,573
PER CAPITA INCOME
98.8/ 100
METRIC RATING
91st/ 347
METRIC RANK
$33,236
PER CAPITA INCOME
0.0/ 100
METRIC RATING
335th/ 347
METRIC RANK
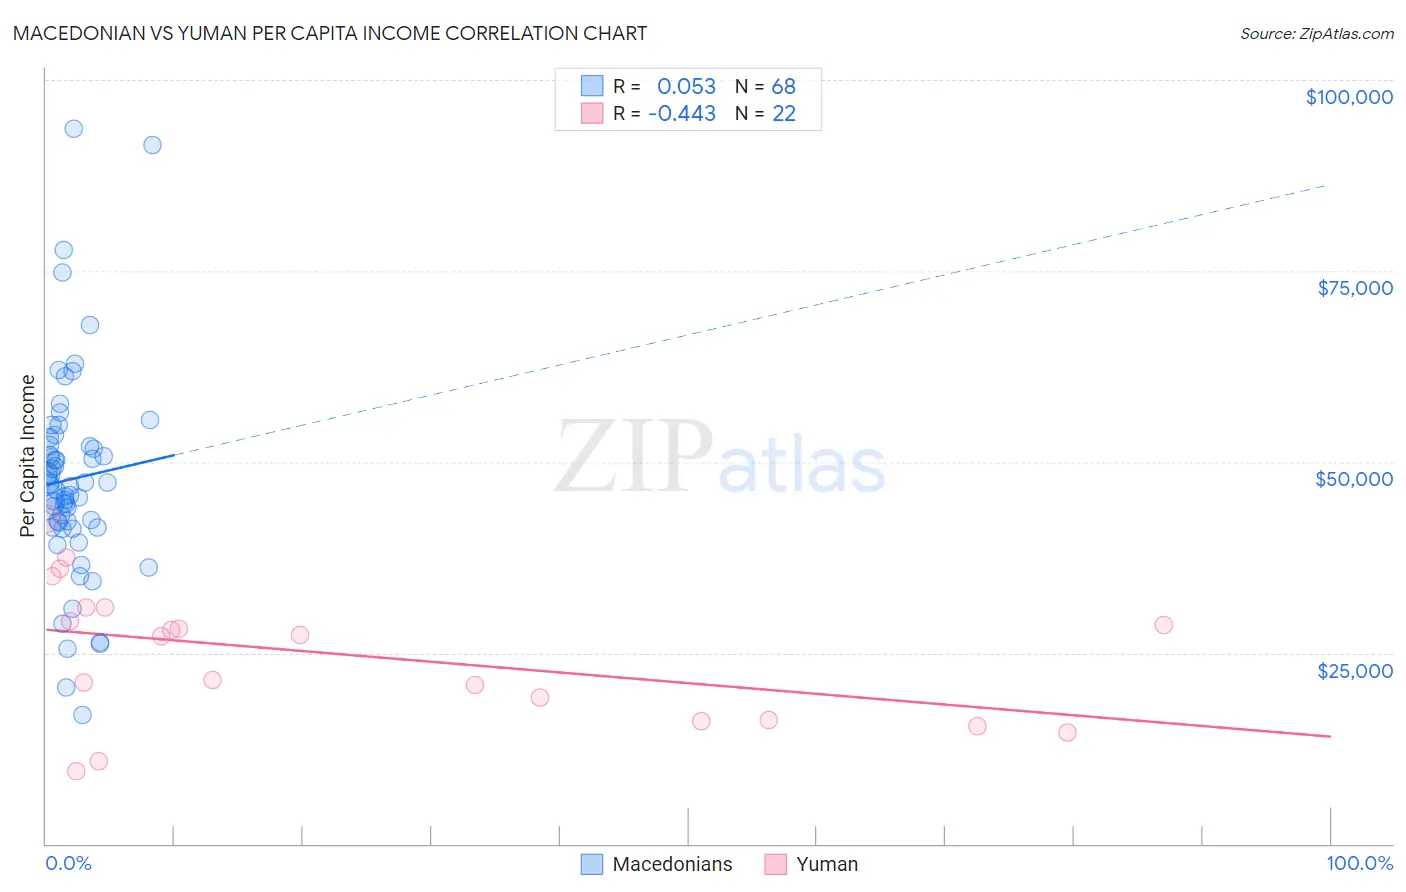
Macedonian vs Yuman Per Capita Income Correlation Chart
The statistical analysis conducted on geographies consisting of 132,587,632 people shows a slight positive correlation between the proportion of Macedonians and per capita income in the United States with a correlation coefficient (R) of 0.053 and weighted average of $47,573. Similarly, the statistical analysis conducted on geographies consisting of 40,696,310 people shows a moderate negative correlation between the proportion of Yuman and per capita income in the United States with a correlation coefficient (R) of -0.443 and weighted average of $33,236, a difference of 43.1%.
Per Capita Income Correlation Summary
| Measurement | Macedonian | Yuman |
| Minimum | $16,916 | $9,533 |
| Maximum | $93,662 | $42,569 |
| Range | $76,746 | $33,036 |
| Mean | $47,728 | $24,831 |
| Median | $46,977 | $27,284 |
| Interquartile 25% (IQ1) | $41,808 | $16,137 |
| Interquartile 75% (IQ3) | $52,108 | $30,879 |
| Interquartile Range (IQR) | $10,300 | $14,742 |
| Standard Deviation (Sample) | $13,530 | $8,979 |
| Standard Deviation (Population) | $13,431 | $8,772 |
Similar Demographics by Per Capita Income
Demographics Similar to Macedonians by Per Capita Income
In terms of per capita income, the demographic groups most similar to Macedonians are Italian ($47,574, a difference of 0.0%), Immigrants from Moldova ($47,489, a difference of 0.18%), Northern European ($47,698, a difference of 0.26%), Croatian ($47,742, a difference of 0.36%), and Immigrants from Zimbabwe ($47,394, a difference of 0.38%).
| Demographics | Rating | Rank | Per Capita Income |
| Immigrants | Ukraine | 99.3 /100 | #84 | Exceptional $48,134 |
| Austrians | 99.3 /100 | #85 | Exceptional $48,116 |
| Immigrants | Southern Europe | 99.3 /100 | #86 | Exceptional $48,027 |
| Ukrainians | 99.3 /100 | #87 | Exceptional $48,014 |
| Croatians | 99.0 /100 | #88 | Exceptional $47,742 |
| Northern Europeans | 98.9 /100 | #89 | Exceptional $47,698 |
| Italians | 98.8 /100 | #90 | Exceptional $47,574 |
| Macedonians | 98.8 /100 | #91 | Exceptional $47,573 |
| Immigrants | Moldova | 98.7 /100 | #92 | Exceptional $47,489 |
| Immigrants | Zimbabwe | 98.5 /100 | #93 | Exceptional $47,394 |
| Albanians | 98.5 /100 | #94 | Exceptional $47,379 |
| Immigrants | Egypt | 98.5 /100 | #95 | Exceptional $47,361 |
| Alsatians | 98.3 /100 | #96 | Exceptional $47,284 |
| Carpatho Rusyns | 98.2 /100 | #97 | Exceptional $47,248 |
| Immigrants | Pakistan | 97.9 /100 | #98 | Exceptional $47,084 |
Demographics Similar to Yuman by Per Capita Income
In terms of per capita income, the demographic groups most similar to Yuman are Native/Alaskan ($33,279, a difference of 0.13%), Yakama ($33,009, a difference of 0.69%), Houma ($32,996, a difference of 0.73%), Immigrants from Yemen ($33,696, a difference of 1.4%), and Sioux ($33,921, a difference of 2.1%).
| Demographics | Rating | Rank | Per Capita Income |
| Menominee | 0.0 /100 | #328 | Tragic $34,578 |
| Mexicans | 0.0 /100 | #329 | Tragic $34,559 |
| Spanish American Indians | 0.0 /100 | #330 | Tragic $34,195 |
| Immigrants | Mexico | 0.0 /100 | #331 | Tragic $33,931 |
| Sioux | 0.0 /100 | #332 | Tragic $33,921 |
| Immigrants | Yemen | 0.0 /100 | #333 | Tragic $33,696 |
| Natives/Alaskans | 0.0 /100 | #334 | Tragic $33,279 |
| Yuman | 0.0 /100 | #335 | Tragic $33,236 |
| Yakama | 0.0 /100 | #336 | Tragic $33,009 |
| Houma | 0.0 /100 | #337 | Tragic $32,996 |
| Arapaho | 0.0 /100 | #338 | Tragic $32,345 |
| Pueblo | 0.0 /100 | #339 | Tragic $32,012 |
| Crow | 0.0 /100 | #340 | Tragic $31,729 |
| Puerto Ricans | 0.0 /100 | #341 | Tragic $31,268 |
| Hopi | 0.0 /100 | #342 | Tragic $31,177 |