Greek vs Yuman Single Female Poverty
COMPARE
Greek
Yuman
Single Female Poverty
Single Female Poverty Comparison
Greeks
Yuman
19.4%
SINGLE FEMALE POVERTY
99.2/ 100
METRIC RATING
86th/ 347
METRIC RANK
29.4%
SINGLE FEMALE POVERTY
0.0/ 100
METRIC RATING
337th/ 347
METRIC RANK
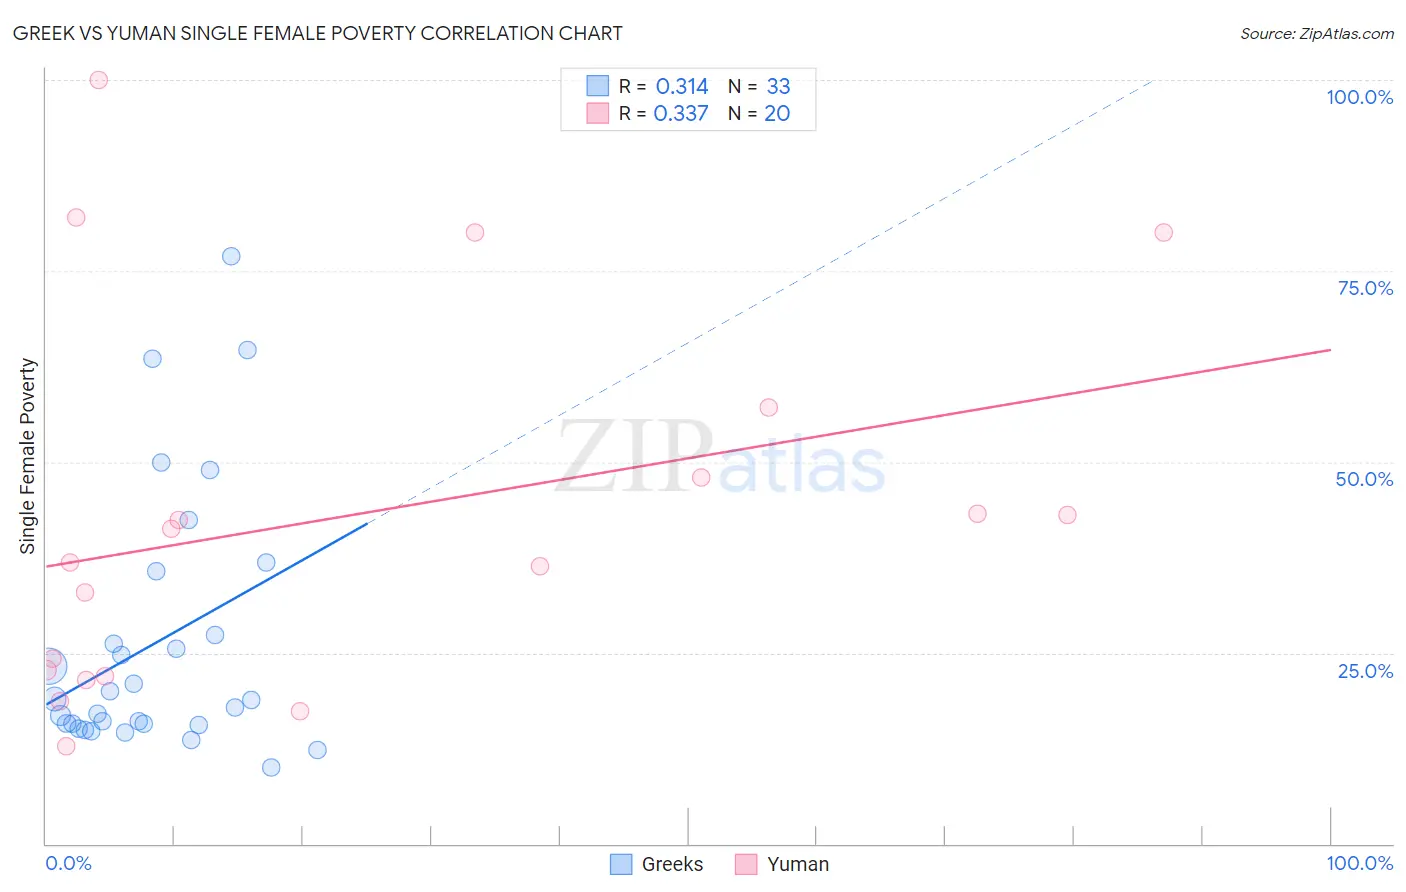
Greek vs Yuman Single Female Poverty Correlation Chart
The statistical analysis conducted on geographies consisting of 470,908,481 people shows a mild positive correlation between the proportion of Greeks and poverty level among single females in the United States with a correlation coefficient (R) of 0.314 and weighted average of 19.4%. Similarly, the statistical analysis conducted on geographies consisting of 40,574,686 people shows a mild positive correlation between the proportion of Yuman and poverty level among single females in the United States with a correlation coefficient (R) of 0.337 and weighted average of 29.4%, a difference of 51.4%.
Single Female Poverty Correlation Summary
| Measurement | Greek | Yuman |
| Minimum | 10.0% | 12.7% |
| Maximum | 76.9% | 100.0% |
| Range | 66.9% | 87.3% |
| Mean | 26.2% | 43.1% |
| Median | 18.9% | 39.0% |
| Interquartile 25% (IQ1) | 15.7% | 22.3% |
| Interquartile 75% (IQ3) | 31.5% | 52.6% |
| Interquartile Range (IQR) | 15.8% | 30.3% |
| Standard Deviation (Sample) | 17.0% | 24.9% |
| Standard Deviation (Population) | 16.7% | 24.2% |
Similar Demographics by Single Female Poverty
Demographics Similar to Greeks by Single Female Poverty
In terms of single female poverty, the demographic groups most similar to Greeks are Immigrants from Albania (19.4%, a difference of 0.0%), Immigrants from Sweden (19.4%, a difference of 0.040%), Taiwanese (19.4%, a difference of 0.12%), Immigrants from Scotland (19.4%, a difference of 0.14%), and Immigrants from Malaysia (19.4%, a difference of 0.14%).
| Demographics | Rating | Rank | Single Female Poverty |
| Immigrants | Sierra Leone | 99.3 /100 | #79 | Exceptional 19.4% |
| Immigrants | Australia | 99.3 /100 | #80 | Exceptional 19.4% |
| Immigrants | Scotland | 99.2 /100 | #81 | Exceptional 19.4% |
| Immigrants | Malaysia | 99.2 /100 | #82 | Exceptional 19.4% |
| Taiwanese | 99.2 /100 | #83 | Exceptional 19.4% |
| Immigrants | Sweden | 99.2 /100 | #84 | Exceptional 19.4% |
| Immigrants | Albania | 99.2 /100 | #85 | Exceptional 19.4% |
| Greeks | 99.2 /100 | #86 | Exceptional 19.4% |
| Zimbabweans | 99.0 /100 | #87 | Exceptional 19.5% |
| Afghans | 99.0 /100 | #88 | Exceptional 19.5% |
| Immigrants | Ukraine | 99.0 /100 | #89 | Exceptional 19.5% |
| Immigrants | Lebanon | 98.8 /100 | #90 | Exceptional 19.6% |
| Soviet Union | 98.8 /100 | #91 | Exceptional 19.6% |
| Italians | 98.8 /100 | #92 | Exceptional 19.6% |
| Immigrants | Austria | 98.8 /100 | #93 | Exceptional 19.6% |
Demographics Similar to Yuman by Single Female Poverty
In terms of single female poverty, the demographic groups most similar to Yuman are Colville (29.1%, a difference of 1.3%), Immigrants from Yemen (28.9%, a difference of 1.8%), Pueblo (28.6%, a difference of 2.9%), Pima (30.3%, a difference of 3.0%), and Cheyenne (30.4%, a difference of 3.2%).
| Demographics | Rating | Rank | Single Female Poverty |
| Hopi | 0.0 /100 | #330 | Tragic 28.0% |
| Natives/Alaskans | 0.0 /100 | #331 | Tragic 28.2% |
| Yakama | 0.0 /100 | #332 | Tragic 28.3% |
| Ute | 0.0 /100 | #333 | Tragic 28.4% |
| Pueblo | 0.0 /100 | #334 | Tragic 28.6% |
| Immigrants | Yemen | 0.0 /100 | #335 | Tragic 28.9% |
| Colville | 0.0 /100 | #336 | Tragic 29.1% |
| Yuman | 0.0 /100 | #337 | Tragic 29.4% |
| Pima | 0.0 /100 | #338 | Tragic 30.3% |
| Cheyenne | 0.0 /100 | #339 | Tragic 30.4% |
| Cajuns | 0.0 /100 | #340 | Tragic 30.6% |
| Sioux | 0.0 /100 | #341 | Tragic 31.3% |
| Navajo | 0.0 /100 | #342 | Tragic 31.7% |
| Crow | 0.0 /100 | #343 | Tragic 32.4% |
| Lumbee | 0.0 /100 | #344 | Tragic 33.0% |