Spanish American vs Yuman Single Female Poverty
COMPARE
Spanish American
Yuman
Single Female Poverty
Single Female Poverty Comparison
Spanish Americans
Yuman
24.2%
SINGLE FEMALE POVERTY
0.0/ 100
METRIC RATING
288th/ 347
METRIC RANK
29.4%
SINGLE FEMALE POVERTY
0.0/ 100
METRIC RATING
337th/ 347
METRIC RANK
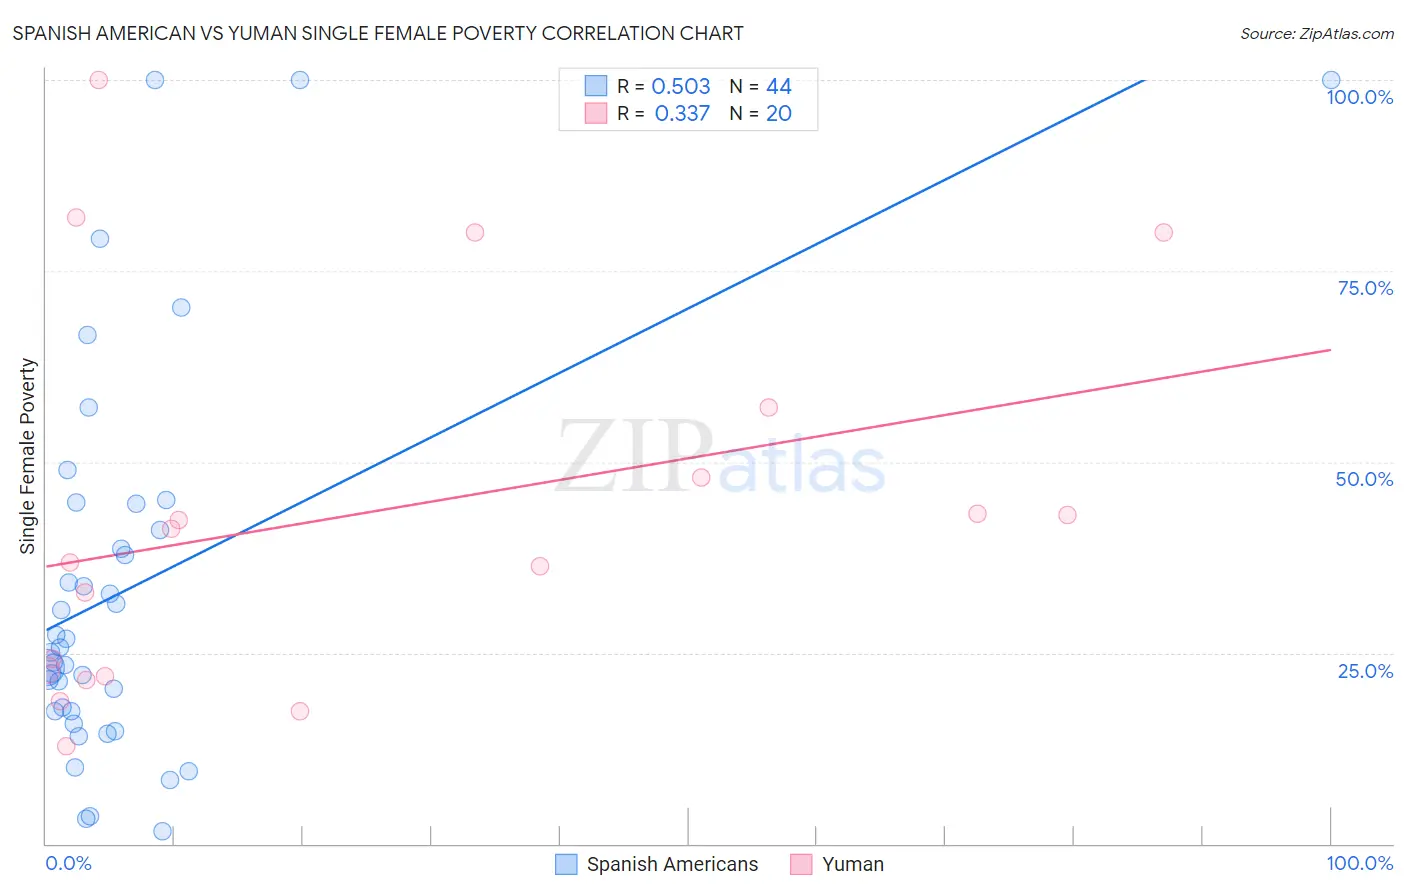
Spanish American vs Yuman Single Female Poverty Correlation Chart
The statistical analysis conducted on geographies consisting of 102,906,499 people shows a substantial positive correlation between the proportion of Spanish Americans and poverty level among single females in the United States with a correlation coefficient (R) of 0.503 and weighted average of 24.2%. Similarly, the statistical analysis conducted on geographies consisting of 40,574,686 people shows a mild positive correlation between the proportion of Yuman and poverty level among single females in the United States with a correlation coefficient (R) of 0.337 and weighted average of 29.4%, a difference of 21.8%.
Single Female Poverty Correlation Summary
| Measurement | Spanish American | Yuman |
| Minimum | 1.6% | 12.7% |
| Maximum | 100.0% | 100.0% |
| Range | 98.4% | 87.3% |
| Mean | 33.3% | 43.1% |
| Median | 25.4% | 39.0% |
| Interquartile 25% (IQ1) | 17.4% | 22.3% |
| Interquartile 75% (IQ3) | 42.8% | 52.6% |
| Interquartile Range (IQR) | 25.4% | 30.3% |
| Standard Deviation (Sample) | 25.1% | 24.9% |
| Standard Deviation (Population) | 24.8% | 24.2% |
Similar Demographics by Single Female Poverty
Demographics Similar to Spanish Americans by Single Female Poverty
In terms of single female poverty, the demographic groups most similar to Spanish Americans are Bangladeshi (24.2%, a difference of 0.020%), U.S. Virgin Islander (24.2%, a difference of 0.050%), Cree (24.1%, a difference of 0.17%), Immigrants from Guatemala (24.1%, a difference of 0.21%), and Indonesian (24.3%, a difference of 0.40%).
| Demographics | Rating | Rank | Single Female Poverty |
| Immigrants | Zaire | 0.0 /100 | #281 | Tragic 23.8% |
| Guatemalans | 0.0 /100 | #282 | Tragic 23.8% |
| German Russians | 0.0 /100 | #283 | Tragic 23.9% |
| Immigrants | Dominica | 0.0 /100 | #284 | Tragic 23.9% |
| Immigrants | Guatemala | 0.0 /100 | #285 | Tragic 24.1% |
| Cree | 0.0 /100 | #286 | Tragic 24.1% |
| Bangladeshis | 0.0 /100 | #287 | Tragic 24.2% |
| Spanish Americans | 0.0 /100 | #288 | Tragic 24.2% |
| U.S. Virgin Islanders | 0.0 /100 | #289 | Tragic 24.2% |
| Indonesians | 0.0 /100 | #290 | Tragic 24.3% |
| Osage | 0.0 /100 | #291 | Tragic 24.4% |
| Alsatians | 0.0 /100 | #292 | Tragic 24.5% |
| Americans | 0.0 /100 | #293 | Tragic 24.5% |
| French American Indians | 0.0 /100 | #294 | Tragic 24.6% |
| Hispanics or Latinos | 0.0 /100 | #295 | Tragic 24.6% |
Demographics Similar to Yuman by Single Female Poverty
In terms of single female poverty, the demographic groups most similar to Yuman are Colville (29.1%, a difference of 1.3%), Immigrants from Yemen (28.9%, a difference of 1.8%), Pueblo (28.6%, a difference of 2.9%), Pima (30.3%, a difference of 3.0%), and Cheyenne (30.4%, a difference of 3.2%).
| Demographics | Rating | Rank | Single Female Poverty |
| Hopi | 0.0 /100 | #330 | Tragic 28.0% |
| Natives/Alaskans | 0.0 /100 | #331 | Tragic 28.2% |
| Yakama | 0.0 /100 | #332 | Tragic 28.3% |
| Ute | 0.0 /100 | #333 | Tragic 28.4% |
| Pueblo | 0.0 /100 | #334 | Tragic 28.6% |
| Immigrants | Yemen | 0.0 /100 | #335 | Tragic 28.9% |
| Colville | 0.0 /100 | #336 | Tragic 29.1% |
| Yuman | 0.0 /100 | #337 | Tragic 29.4% |
| Pima | 0.0 /100 | #338 | Tragic 30.3% |
| Cheyenne | 0.0 /100 | #339 | Tragic 30.4% |
| Cajuns | 0.0 /100 | #340 | Tragic 30.6% |
| Sioux | 0.0 /100 | #341 | Tragic 31.3% |
| Navajo | 0.0 /100 | #342 | Tragic 31.7% |
| Crow | 0.0 /100 | #343 | Tragic 32.4% |
| Lumbee | 0.0 /100 | #344 | Tragic 33.0% |